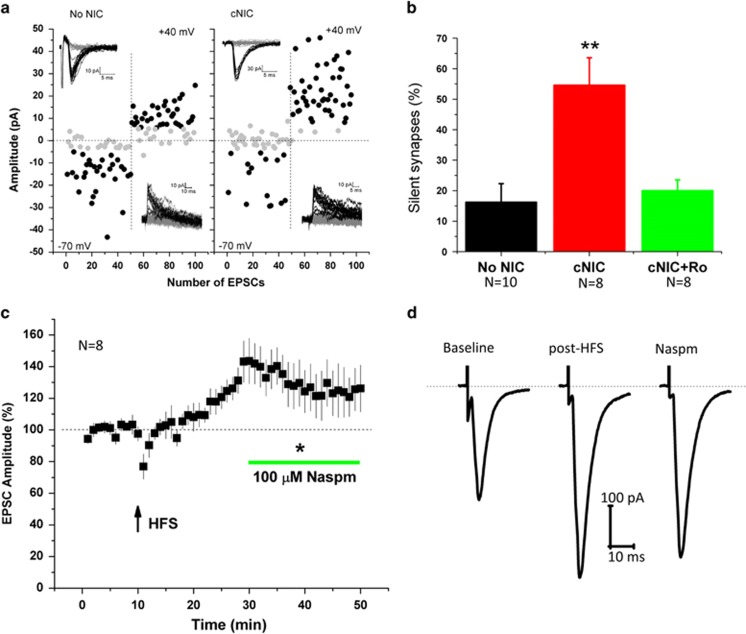
Figure 5.
Exposure to cNIC generates NR2B-enriched silent synapses. (a) Example plot of EPSC amplitude evoked by minimal stimulation assay at −70 and +40 mV (50 consecutive trials each) in non-NIC-treated and cNIC-treated mice. Black dots indicate successful response, gray dots indicate failure. Insets: current traces from individual trials of representative plots. (b) Average percentage of silent synapses in non-NIC-treated (black bar), cNIC-treated (red bar) and cNIC treat with Ro25-6981 (1 μM) application (green bar). (c) EPSC amplitude in response to HFS (arrow) and subsequent application of Naspm (100 μM) in cNIC-treated mice. (d) Representative traces of EPSC at baseline, after HFS and following Naspm perfusion, as shown in (c). Data are presented as mean±SEM. *p<0.05, **p<0.01.

