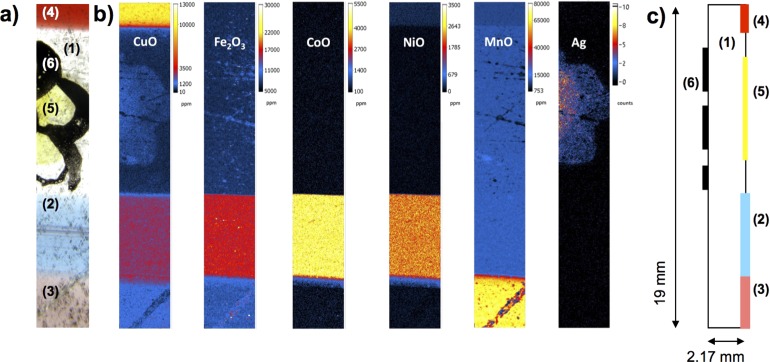
Figure 2.
(a) Macrophotography of the analyzed area. (b) Quantitative chemical mappings of the main transition metal elements on the exterior face of the glass, revealing the colored stripes [blue (2), purple (3), and red (4)] and the yellow flower shape (5). (c) Scheme of the structure of the sample.

