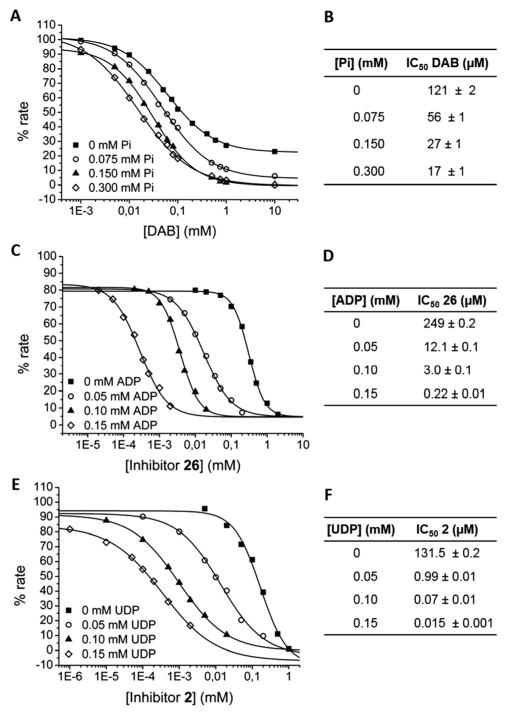
Fig. 4.
Sigmoidal plot of the percentage of RMGPa (A), EcGS (C) and SuSy4 (E) activity at varying concentrations of DAB (A), 26 (C) or 2 (E). RGMPa and EcGS activities were measured in the direction of glycogen synthesis, and SuSy4 in the direction of fructose synthesis, in the presence of several concentrations of the respective non-sugar component of the donor substrates: Pi for RGMPa (A), ADP for EcGS (C) and UDP for SuSy4 (E). IC50 values calculated from these plots are shown in panels B (DAB, RGMPa), D (26, EcGS) and F (2, SuSy4). Values of tables are mean ± s.e. of three independent samples.

