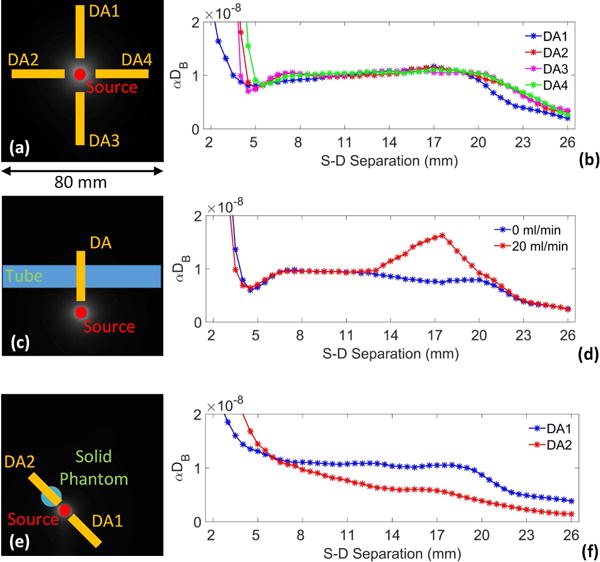
Fig. 4.

Boundary flow index (αDB) distributions over a selected single source and linear detector arrays (DAs). Each DA consisted of 49 detectors with an interval distance of 0.5 mm (2 to 26 mm). (a and b) In the homogeneous liquid phantom the boundary flow indices from 7 to 19 mm were fairly stable. (c and d) With tube placement, the higher flow inside the tube (20 ml/min) against background resulted in greater values in αDB as detected at separations of 7 to 19 mm. (e and f) With spherical solid phantom placement, the zero flow in the solid resulted in lower values in αDB as detected at separations of 7 to 19 mm.
