
Fig. 7.
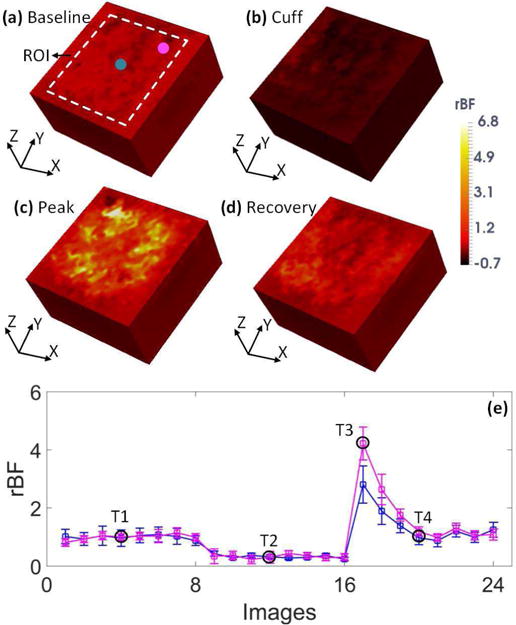
The reconstructed 3D forearm blood flow images at the periods of baseline (a), cuff occlusion (b), reactive hyperemic peak flow (c), and recovery (d), respectively. (e) Blood flow changes relative to their baselines (i.e., rBF) over the period of occlusion protocol inside the selected two small tissue volumes of ~5 mm3. Error bars represent the standard deviations of rBF values inside the small tissue volume. T1 to T4 represent the four time points corresponding to the images taken in (a) to (d). Although large spatial heterogeneity existed, rBF trends and variations throughout the occlusion protocol agree with physiological responses.