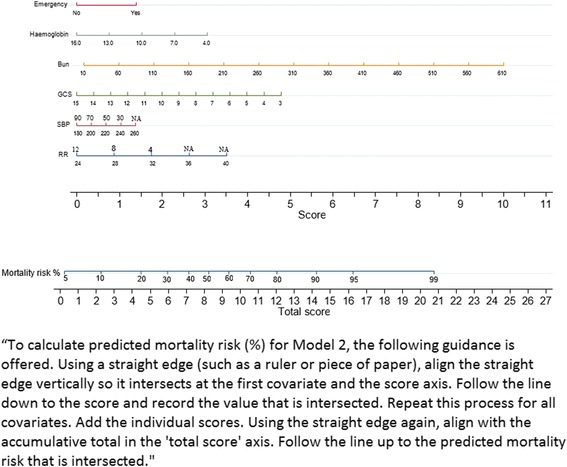
Fig. 1.

Nomogram for model 2. To calculate the predicted mortality risk (%) for model 2, the following guidance is offered. Using a straight edge (such as a ruler or a piece of paper) align the straight edge vertically so it intersects at the first covariate and the score axis. Follow the line down to the score and record the value that is intersected. Repeat this process for all covariates. Add the individual scores. Using the straight edge again, align with the accumulative total on the “total score” axis. Follow the line up to the predicted mortality risk that is intersected. Bun blood urea nitrogen, GCS Glasgow Coma Scale, NA not applicable, RR respiratory rate, SBP systolic blood pressure
