
Fig. 4.
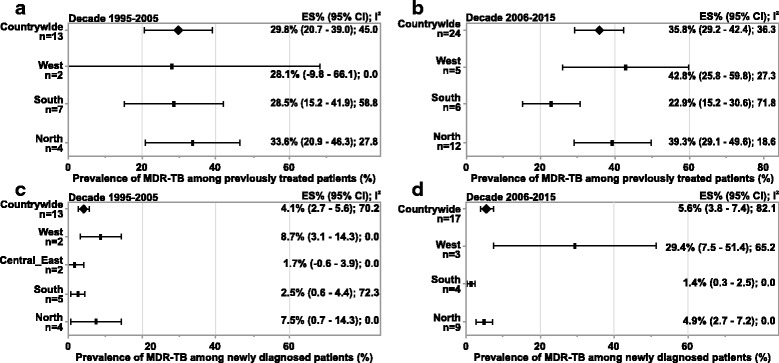
Subgroup analysis- prevalence of MDR-TB among previously treated and newly diagnosed patients.
(a) Decade: 1995 to 2005 (previously treated patients) (b) Decade: 2006 to 2015 (previously treated patients) (c) Decade: 1995 to 2005 (newly diagnosed patients) (d) Decade: 2006 to 2015 (newly diagnosed patients).
Abbreviations: CI, confidence interval; ES, estimate; MDR-TB, multidrug resistant tuberculosis; n, number of studies
Notes: Negative I2 was set to zero.
Any missing data means that studies conducted in that region did not present results eligible for inclusion in this analysis.
Figure 4b and 4d: Countrywide prevalence includes 1 study from Central_East region (not presented individually)