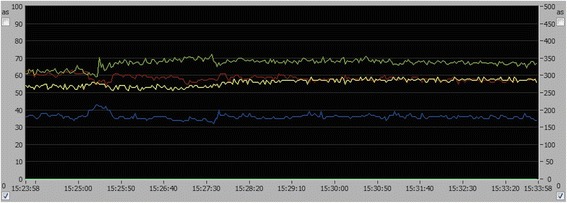
Fig. 2.

Time course of O2C-parameters during real-time monitoring in patient No. 13. Values are displayed in percent (%; left ordinate) or arbitrary units (AU; right ordinate) over time (hrs, min, sec; abscissa). After application of magnesium sulfate (baseline, 15:23:58), local cerebral blood flow (green) and blood cell velocity (yellow) gradually increase. Relative hemoglobin content (red) and capillary venous oxygenation (blue) tended to decrease over the displayed time period of 10 min
