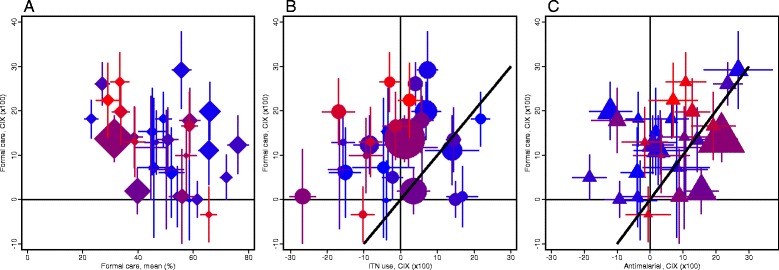
Fig. 1.

Degree of asset-wealth inequality in distribution of malaria interventions in sub-Saharan African countries in 2015a. For each country, the concentration index (CIX) is plotted for (a) access to formal care for fever among children under the age of five is plotted against its population mean (proportion), (b) ITN use, and (c) receipt of antimalarial medication for children under the age of five with fever. Whiskers denote the 95% confidence interval of the estimate. Country marker size is weighted with population size. Marker color code changing from bright blue to bright red refers to country mean malaria prevalence based on 2015 Malaria Atlas Project estimates (corresponding values are given in Additional file 1: Table SA1). aData drawn from a subset of countries with Demographic and Health Survey/Malaria Indicator Survey conducted after 2010 (country list and year of data collection are detailed in Additional file 1: Table SA1).
