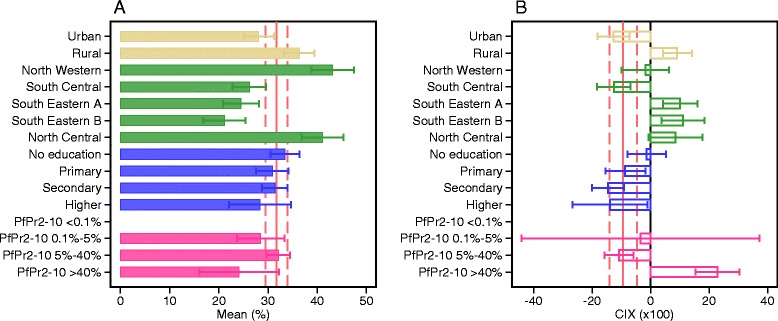
Fig. 3.

Heterogeneity in distribution of malaria interventions over transmission and alternate socioeconomic stratifiers in Liberia in 2015a: proportion of population who slept under an ITN the previous night. a Mean and 95% confidence interval for the proportion of population who slept under an ITN the previous night within each dimension: place of residence (urban or rural), region ((North Western, South Central, South Eastern A, South Eastern B, North Central), mother’s highest educational level (no education, primary, secondary, higher), PfPR2-10 level (<0.1%, 0.1–5%, 5–40%, > 40%). The national average and the corresponding confidence interval are shown in solid and dash pink lines respectively. b The degree of inequality, summarized here in a concentration index and 95% confidence interval, in distribution of ITN use with respect to asset-wealth index within each dimension. National average of the concentration index and the corresponding confidence interval are shown in solid and dash pink lines respectively. aData drawn from Liberia Demographic and Health Survey 2013
