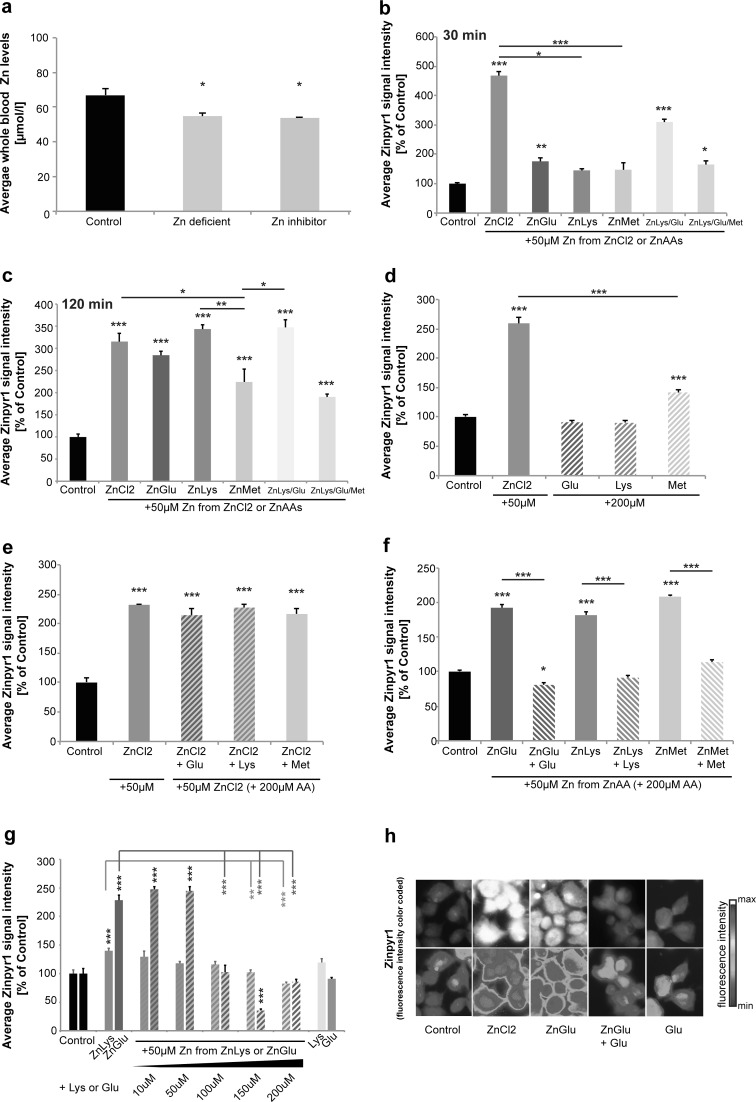
Fig. 1.
Uptake of Zn from ZnAAs in Caco-2 cells. a Blood levels of Zn from mice on different diets for 9 weeks. Whole-blood Zn levels were investigated by AAS in three animals per group. Animals on a Zn deficient diet (Diet 2) show significantly reduced Zn levels compared to mice on the control diet (Diet 1). Mice on the control diet with increased levels of Zn uptake antagonists (Diet 3) similarly show a significant reduction in blood-zinc levels. b–h Zinpyr-1 fluorescence intensity of Caco-2 cells incubated for 30 min with ZnCl2 solution (50 μM) or ZnAAs delivering an equivalent of 50 μM Zn2+. b ZnCl2 solution, ZnGlu, and ZnLys/Glu and ZnLys/Glu/Met significantly increase intracellular Zn. A trend for an increase was seen after application of ZnLys and ZnMet. ZnCl2 solution increases intracellular Zn levels significantly more compared to ZnLys and ZnMet (n = 10 cells per group). c After 120 min, ZnCl2 solution and all ZnAAs lead to a significant increase in intracellular Zn (n = 10 cells per group). d Application of Glu and Lys alone do not lead to differences in Zn compared to untreated controls. The application of Met alone results in a significant increase in intracellular Zn compared to controls, but significantly less than seen with ZnCl2 solution (n = 10). e The significant increase in intracellular Zn levels provided by ZnCl2 solution is not affected by the presence of a surplus of AAs in the medium. f A significant increase in intracellular Zn after application of ZnGlu, ZnLys, and ZnMet was not present when ZnGlu, ZnLys, and ZnMet were applied together with Glu, Lys and Met, respectively. g The increase in intracellular Zn is reduced in a concentration dependent manner by co-application of 10, 50, 100, 150 and 200 μM Lys or Glu, respectively (n = 10). h Exemplary images for Caco-2 cells stained with Zinpyr-1 are shown. The bottom row shows the Zinypr1 signal intensity color-coded

