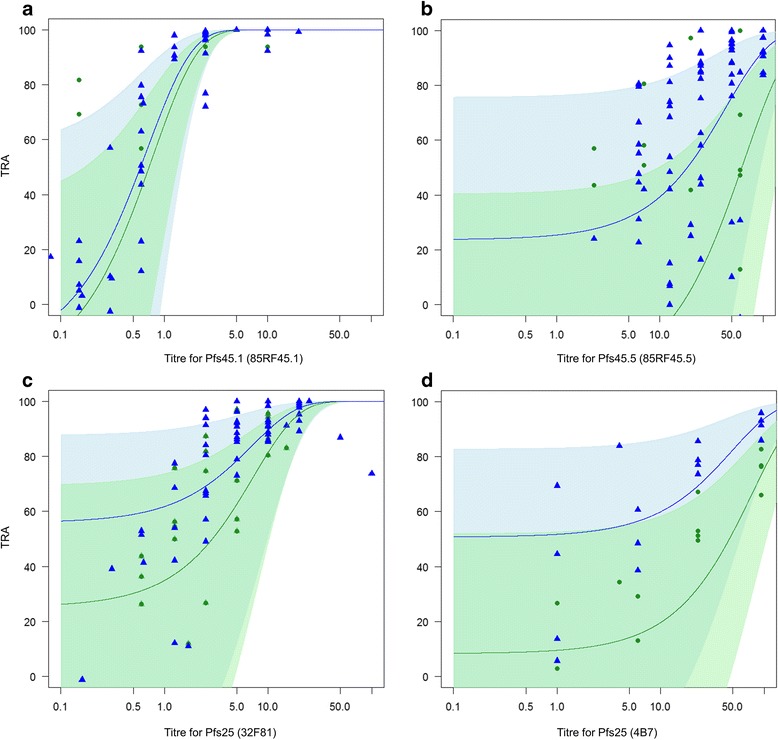
Fig. 3.

TRA of antibodies against Pfs48/45 (mAb 85RF45.1 and mAb 85RF45.5) and Pfs25 (mAb 32F81 and mAb 4B7) in An. gambiae and An. stephensi mosquitoes. Figures show the estimates of TRA as relative reduction in oocyst intensity for each experiment (dots for An. gambiae experiments, triangles for An. stephensi experiments) and the GLMM model predictions and confidence intervals (lines and shaded areas). TRA of mAb in An. gambiae is shown in green and for An. stephensi it is shown in blue. a Relation between An. gambiae and An. stephensi for TRA of mAb 85RF45.1. b Relation between An. gambiae and An. stephensi for TRA of mAb 85RF45.5. c Relation between An. gambiae and An. stephensi for TRA of mAb 32F81. d Relation between An. gambiae and An. stephensi for TRA of mAb 4B7. All TRA calculations were made using human serum controls
