Fig. 3.

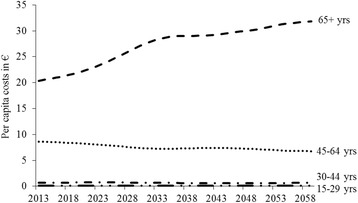
Per capita costs of inactivity by age-group, 2014–2060 (in 2008€). Predicted per capita costs of inactivity for the period 2014–2060 differentiated by four age groups (15–29; 30–44; 45–64; 65+)

Per capita costs of inactivity by age-group, 2014–2060 (in 2008€). Predicted per capita costs of inactivity for the period 2014–2060 differentiated by four age groups (15–29; 30–44; 45–64; 65+)