
Fig. 1.
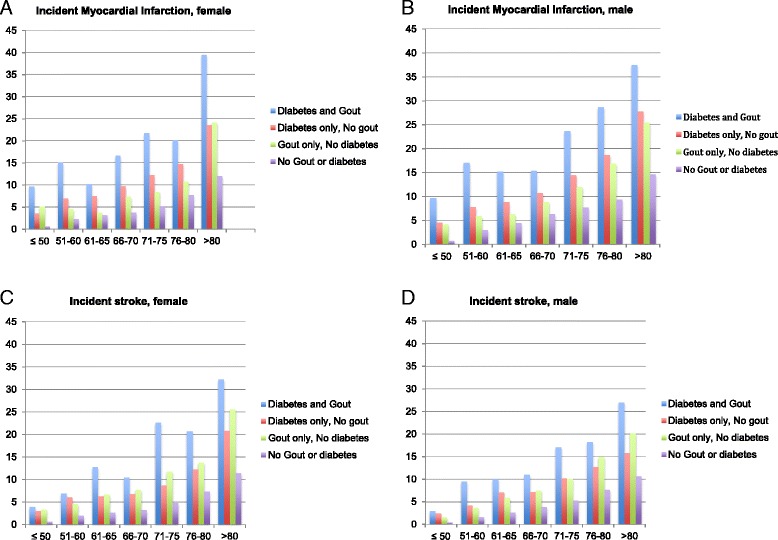
Unadjusted rates/1000 patient-years of incident myocardial infarction (MI) (a and b) and stroke (c and d) based on the presence/absence of diabetes and gout, by age and sex. x-Axis shows the age groups in years, and y-axis shows the incidence rates/1000 patient-years for incident MI in females (a) and males (b) and of incident stroke in females (c) and males (d)