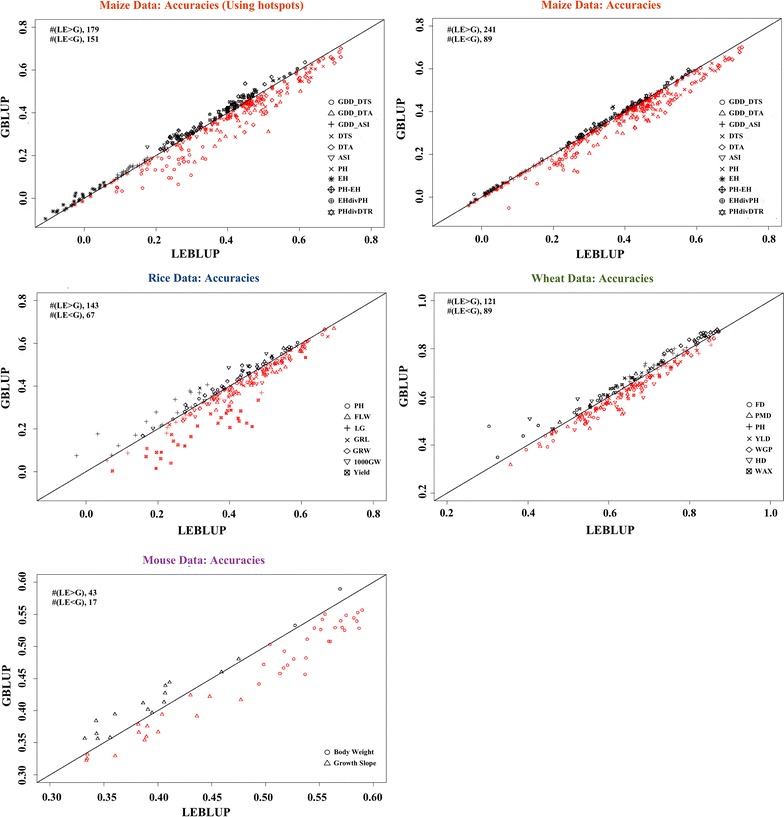
Fig. 3.

Accuracy obtained with the LER and GBLUP models (measured as the correlation between the estimated genetic values and the response variable) for each of the 30 replicates for each trait in all datasets. The red colored data points below the y = x show the instances where the LER models performed better than the GBLUP models. Black colored data points show the instances where the GBLUP models performed better than the LER models. The number of times that each model performed better than the other is shown on the top left side for each dataset. GDD_DTA: growing degree days to silk, GDD_DTA growing degree days to anthesis, GDD_ASI growing degree days to anthesis-silking interval, DTS days to silking, DTA days to anthesis, ASI anthesis silking interval days, PH plant height, EH ear height, PH-EH PH minus EH, EHdivPH EH divided by PH, PHdivDTR PH divided by days to anthesis FLW flag leaf width, LG lodging, GRL grain length, GRW grain weight, 1000GW thousand grain weight, YLD yield, FD flowering day, PMD physiological maturity day, WGP whole grain protein, HD heading date Julian, WAX waxiness
