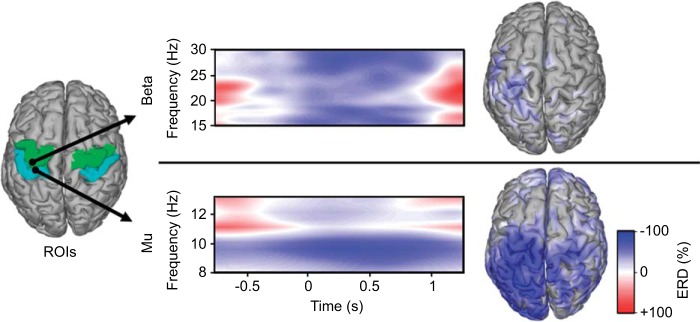
Fig. 2.
Spectral, temporal, and spatial dynamics of event-related desynchronization (ERD) from a participant with complete paralysis (S14) during attempted right hand grasps. The high-resolution time-frequency representations from wavelet decomposition at 0.5-Hz resolution show β-ERD (top) from an M1 source [green region of interest (ROI)] and μ-ERD (bottom) from an S1 source (blue ROI). Time-frequency representations span the grasp/release cycle with the cue to grasp at t = 0. Cortical source images (right) show the spatial distribution of the ERD at the peak frequency for β (28.5 Hz) and μ (9.5 Hz).

