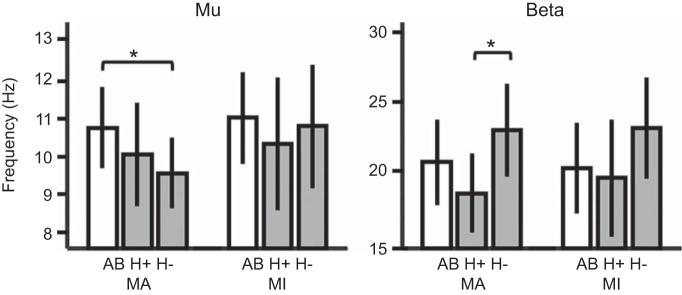
Fig. 5.
Frequency of peak ERD in μ- (left) and β-bands (right) during attempted [motor attempt (MA)] and imagined [motor imagery (MI)] grasping. Participants with SCI (gray bars) who could not generate EMG are labeled H− (n = 5), with all others labeled H+ (n = 7). AB, able-bodied controls (open bars; n = 12). Bars are mean values with error bars as SD. *Significant pairwise comparisons (Bonferroni-corrected post hoc t-tests, P < 0.05).

