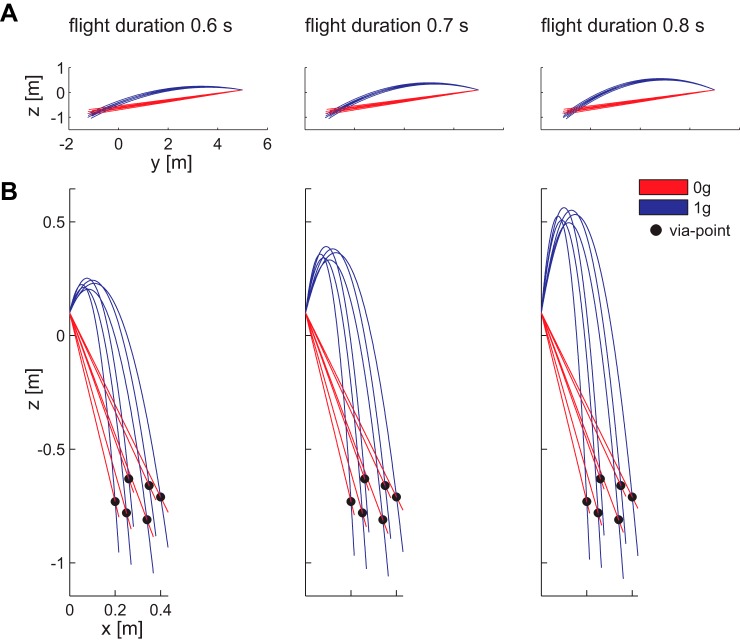
Fig. 2.
Ball paths for different flight conditions. Ball paths are illustrated in the lateral (y-z plane; A) and frontal (x-z plane; B) views for each flight duration, for all via-point positions (black dots) and for both acceleration conditions from the starting position to the point reached 50 ms after passing through the via-point position.

