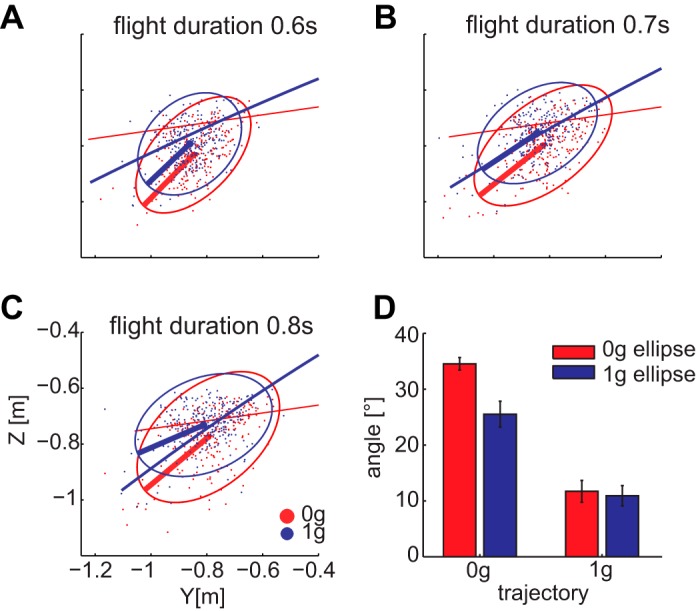
Fig. 8.

Distribution of impact positions in space. A–C: impact points for via point 6 projected on the sagittal plane (y-z) for each ball flight duration and the relative tolerance ellipse including 95% of the points. Color coding identifies different gravity conditions. Thick lines identify the major axis of the ellipse and thin lines the ball trajectory. D: means and SEs of the angles computed between the first eigenvector and the direction of the trajectory at the point of minimum distance from the center of the ellipse. Means are computed pooling results across all the via points and flight durations.
