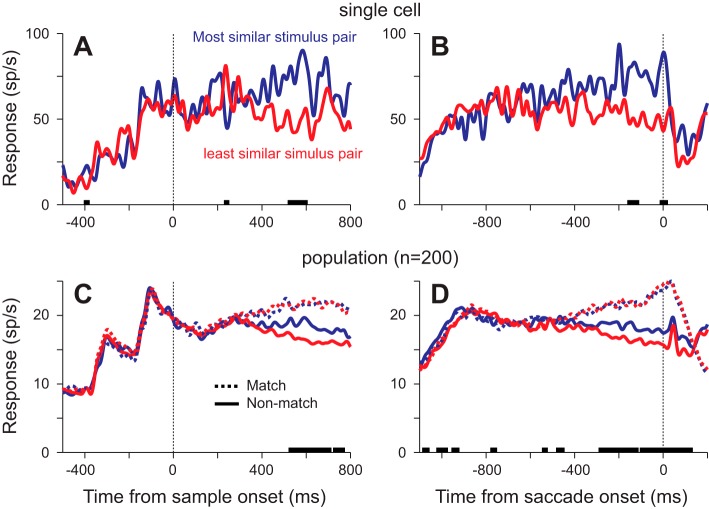
Fig. 3.
Neuronal responses from correct trials to the most similar and least similar stimulus pairs. A and B: mean neuronal responses to a nonmatch stimulus from an example neuron from trials with 200-ms or 400-ms SOAs, aligned by sample onset (A) or saccade onset (B). Using the similarity model, we identified the match-nonmatch pair that were most similar and the pair that were least similar. Thick lines on the x-axis indicate times at which the responses to the nonmatches (solid lines) were significantly different (P < 0.01, t-tests at each millisecond). C and D: mean population responses under the same conditions, aligned by sample onset (C) or saccade onset (D). Solid lines show the response to the nonmatch, and dotted lines show the response to the match in the most (blue) and least (red) similar match-nonmatch pairs. Thick lines on the x-axis indicate times at which the responses to the nonmatches (solid lines) were significantly different (P < 0.01, paired t-tests at each millisecond).

