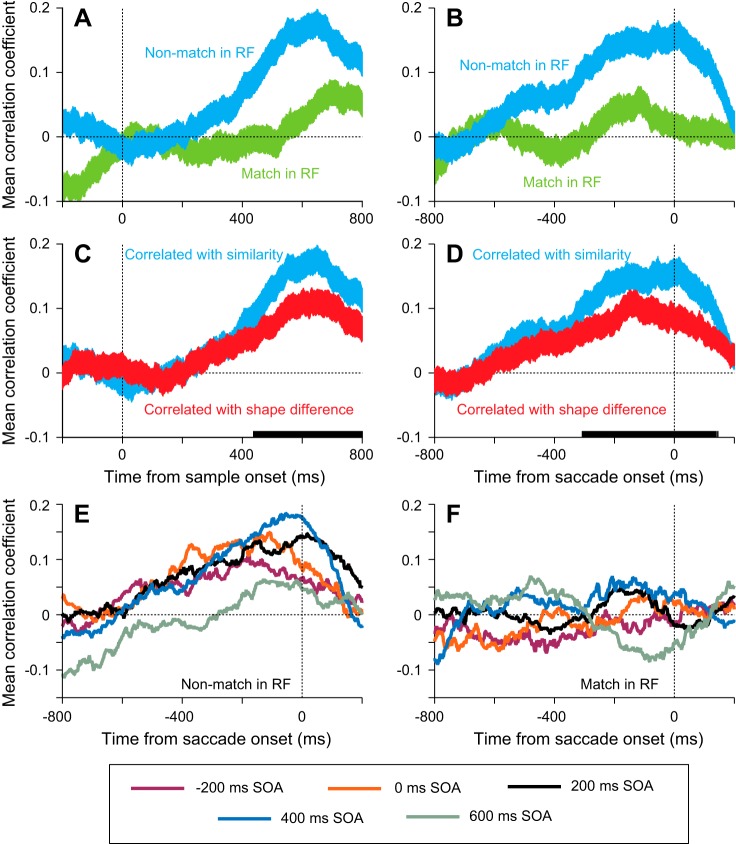
Fig. 5.
Time course of correlation coefficients comparing responses to stimuli with similarity. A and B: mean correlation coefficients from all 200 neurons from the type of analysis illustrated in Fig. 4A plotted as a function of time, aligned by sample onset (A) or saccade onset (B). Data were taken from 200-ms windows stepped every 5 ms and are from trials with SOAs of 200 or 400 ms. Blue, correlations performed on the responses to nonmatches in the response field; green, correlations performed on the responses to matches in the response field. Width of lines shows variance (SE) across neurons. C and D: correlations performed on the responses to nonmatches in the response field to similarity (blue) and to an objective measure of shape difference (red) aligned by sample onset (C) or saccade onset (D). Solid bars on x-axis show time points where the 2 distributions were significantly different (paired t-tests, P < 0.05) E: mean correlation coefficients using stimulus similarity from all 200 neurons for each of the 5 SOAs when a nonmatch was in the response field, aligned by saccade onset. F: mean correlation coefficients from all 200 neurons for each of the 5 SOAs when a match was in the response field, aligned by saccade onset.

