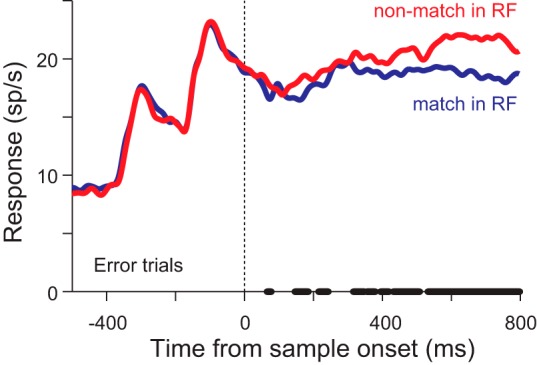
Fig. 9.

Neuronal responses from error trials in which the animal made a saccade to the nonmatch: mean neuronal response from 200 neurons when the sample appeared 200 or 400 ms after the peripheral stimuli when a match was in the response field (blue) or a nonmatch was in the response field (red). Thick line on x-axis indicates times at which the 2 traces were significantly different (P < 0.01, paired t-tests).
