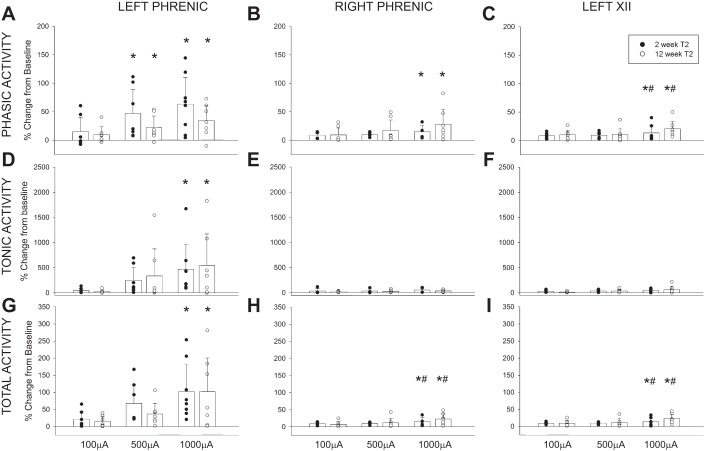
Fig. 6.
Average changes in phrenic and hypoglossal nerve activity following T2 HF-ES. Shown are changes in phasic (A–C), tonic (D–F), and total (G–I) phrenic and hypoglossal nerve activity following HF-ES of the T2 spinal cord, delivered at 2 and 12 wk postinjury. Data were calculated over the 3 min following each bout of stimulation and are represented as %change from baseline activity. A dose-dependent increase in amplitude (%change above baseline) was observed in all nerves (*P < 0.05, different from 100µA; #P < 0.05, different from 500 µA) across all outcomes (phasic, tonic, and total nerve activity), with the greatest amplitude changes occurring following the highest stimulation intensities. Note that profound increases in tonic activity comprised much of the increase in total activity and that the ipsilateral phrenic nerve demonstrated the most dramatic changes in nerve amplitude relative to baseline. No significant group differences were observed in any nerve in any of the outcomes assessed. Data were evaluated using 2-way repeated-measures ANOVA with Holm-Sidak post hoc tests for individual comparisons (groups: 2-wk T2, n = 7; 12-wk T2, n = 7).

