Fig. 2.
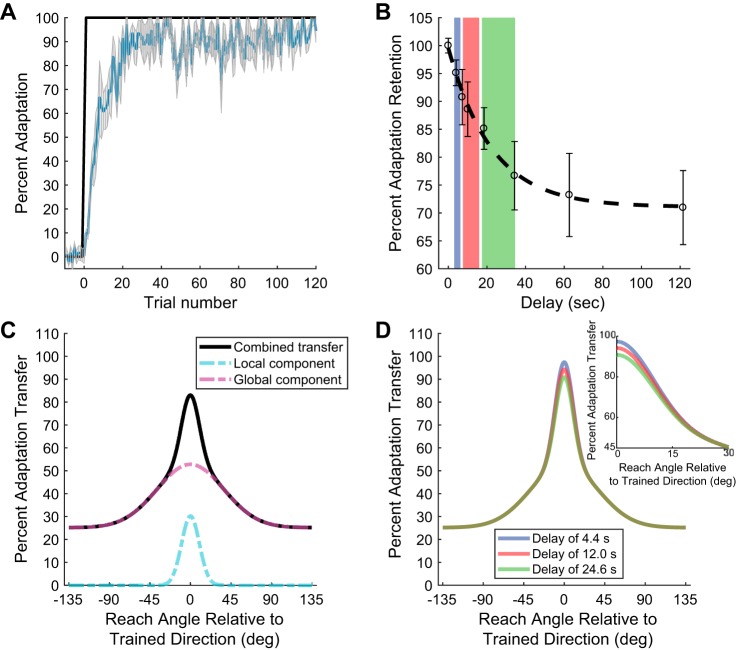
Temporal decay of visuomotor adaptation retention and predicted influence on spatial generalization. A: adaptation curve during training for the temporal delay experiment (n = 12). Blue line represents mean % of adaptation, and shaded area represents SE. Black trace represents magnitude of the visual feedback perturbation. The amount of adaptation at the end of training was significantly greater than at the beginning (20.2 ± 2.0% compared with 91.1 ± 0.3%, mean ± SE, P < 0.01, paired 2-tailed t-test). B: % adaptation retained after each temporal delay is plotted as a function of time. Delay represents the average time before the movement was executed. Circles represent the average across subjects, and vertical bars represent SE. The time constant for the fitted exponential function was 22.5 ± 5.6 s. Color shaded regions represent temporal ranges of 4.4 ± 1.6, 12.0 ± 4.2, and 24.6 ± 8.6 s (± represent 95% confidence intervals). The decay in retention was significant from 0 to 15 s (14.9 ± 3.7% decay, P < 0.05) and 30 s (23.3 ± 6.1% decay, P < 0.01) but not significant from 30 s to 120 s (5.7 ± 2.1% decay from 30 to 120 s, P = 0.31, corrected for multiple comparisons). C: depiction of the 2-component spatial generalization model. There is a local Gaussian-shaped component (dashed light blue trace) and a similar global component with offset (dashed purple trace) that sum for the total generalization (solid black trace). D: based on the exponential function derived in B, the simulated effect on the generalization if the estimated % retention is applied solely to the gain at the trained target direction (retention values of 94.9%, 87.8%, and 80.5%, respectively), keeping all other model parameters constant (k2 = 27.7 ± 8.5%, θ0 = 0°, c = 25.2% ± 2.4%, = 9.9 ± 3.0°, and = 37.1 ± 10.1°). Inset shows the decrease in adaptation transfer for the simulation over the first 30°.

