Fig. 3.
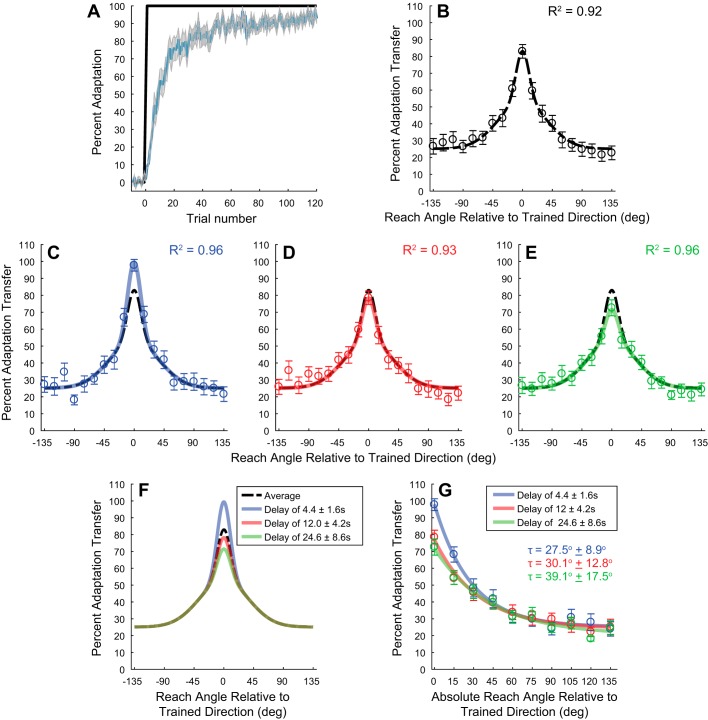
Influence of temporal delay on the spatial generalization of visuomotor adaptation. A: adaptation curve during training for the generalization experiment (n = 32). Blue line represents mean % of adaptation, and shaded area represents SE. Black trace represents magnitude of the visual feedback perturbation The amount of adaptation at the end of training was significantly greater than at the beginning (18.6 ± 1.9% compared with 92.8 ± 0.2%, mean ± SE, P < 0.01, 2-tailed t-test). B: average spatial generalization over all subjects for the entire data set. Bars represent SE. Black dashed line is the 2-component spatial generalization model fit to the experimental data (k1 = 30.2 ± 10.6%, k2 = 27.7 ± 8.5%, θ0 = 0°, c = 25.2% ± 2.4%, = 9.9 ± 3.0°, and = 37.1 ± 10.1°). C–E: respective spatial generalization and corresponding functions for the delays of 4.4 ± 1.6 s (C), 12.0 ± 4.2 s (D), and 24.6 ± 8.6 s (E) (± represent 95% confidence intervals). Colored traces represent the 2-component spatial generalization model fits to the respective experimental data. k1 for the different delay values are 46.6 ± 7.2%, 25.4 ± 7.7%, and 18.7 ± 5.5% for 4.4 ± 1.6, 12.0 ± 4.2, and 24.6 ± 8.6 s, respectively. F: comparison of the generalization functions from B–E. G: change in % adaptation transfer as a function of the absolute spatial distance from the trained target direction. Spatial constants for the delay of 4.4 s: 27.5 ± 8.9°, 12.0 s: 30.1 ± 12.8°, 24.6 s: 39.1 ± 17.5°.

