
Figure 4.
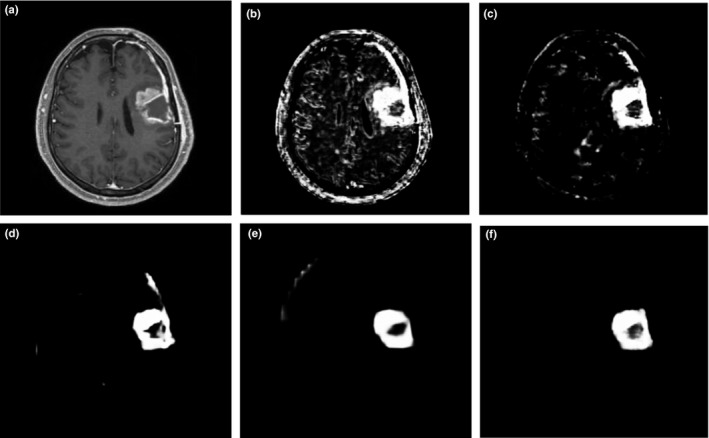
Illustration of output prediction maps. (a) one slice of the T1c component of input MRI image; and corresponding prediction maps (b) from the first side‐output layer; (c) from the second side‐output layer; (d) from the third side‐output layer; (e) from the 4th side‐output layer; (f) from the fusion layer.