
Figure 5.
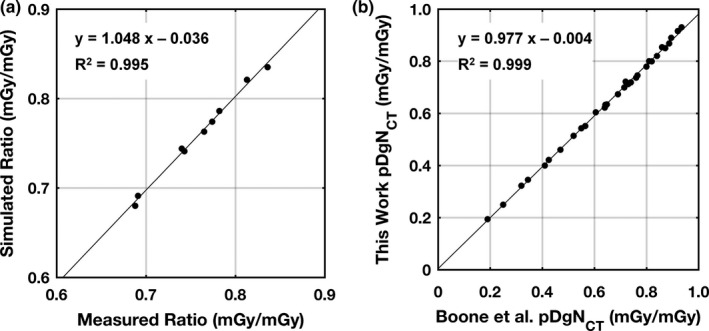
(a) MCNP6 simulation results for kerma ratios (i.e., air kerma in‐phantom to free‐in‐air) compared with physical measurements on the Doheny bCT system at UC Davis. The comparisons shown are for the V1, V3, and V5 phantoms at 50, 60, and 70 kV with 0.2 mm of Cu filtration. (b) Comparison of pDgNCT coefficients simulated in MCNP6 with a reference data set for 10 and 18 cm diameter cylinders (0% and 50% fibroglandular tissue), and tube voltages spanning from 30 to 100 kV in 10 kV intervals. A linear fit to the data points is shown for each comparison along with the coefficient of determination.