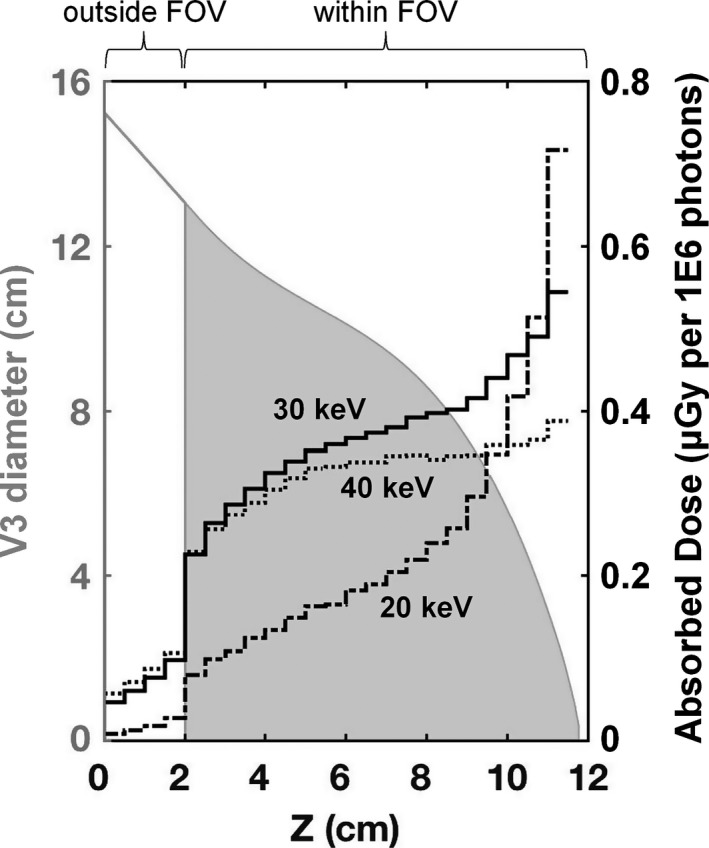
Figure 9.

Dose distribution profiles (right axis) spanning from the posterior to anterior region of the V3 phantom composed of 17% fibroglandular tissue. Results are shown for 20, 30, and 40 keV monoenergetic source photons. The irradiated V3 phantom (solid gray area) is overlaid and labeled on the left axis. The extrapolated 2 cm tissue region outside of the FOV is also shown with only a gray outline.
