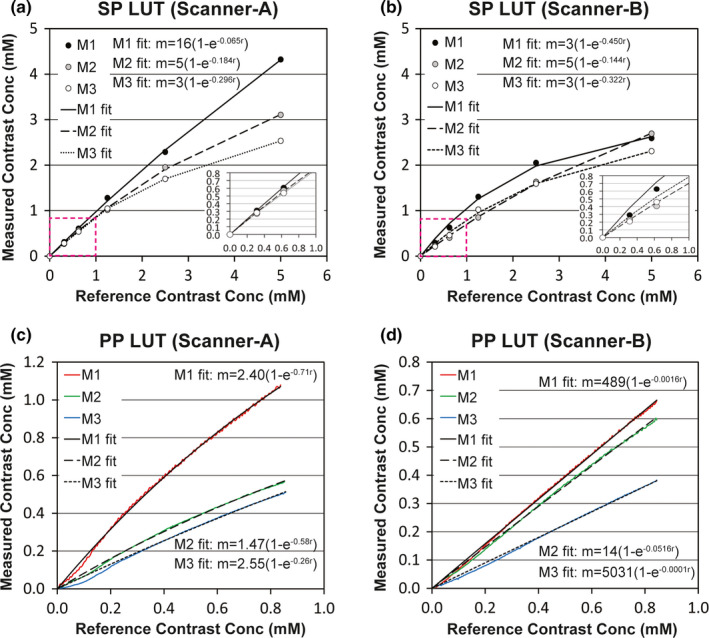
Figure 7.

Graphical representation of look‐up tables (LUTs) obtained using either static phantom (SP) or perfusion phantom (PP). (a, b) LUTs to correlate the reference (known) contrast concentrations with the measured ones of static phantom in either (a) Scanner‐A or (b) Scanner‐B in the range of 0~5 mM. LUTs in the range of 0~1 mM, indicated with dotted boxes, were inserted. (c, d) LUTs to correlate the reference contrast enhancement curve of the perfusion phantom (0.11 mM per min) with the measured ones in either (c) Scanner‐A or (d) Scanner‐B. The equation of each fitting curve was inserted, and R2 value was higher than 0.99 in all fittings. [Color figure can be viewed at wileyonlinelibrary.com]
