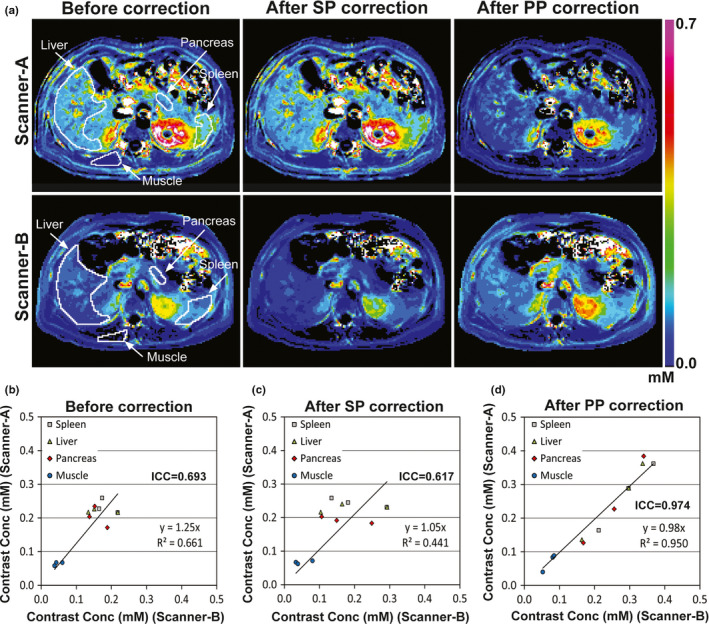
Figure 8.

Contrast maps at 4.5 min after contrast injection before and after correction. (a) Contrast maps of a volunteer obtained from either Scanner‐A (first row) or Scanner‐B (second row) before and after correction using look‐up tables of static phantom (SP) or perfusion phantom (PP). The boundaries of four organ regions (liver, spleen, pancreas, muscle) are indicated with white solid lines in the first‐column images. The same color scale (0~0.7 mM) was applied for all sub‐figures. (b–d) Contrast concentrations (mM) averaged in each of the four organs of three volunteers (n = 12), when Scanner‐A (Y‐axis) or Scanner‐B (X‐axis) was used, (b) before and (c, d) after correction using look‐up tables of (c) static phantom or (d) perfusion phantom.
