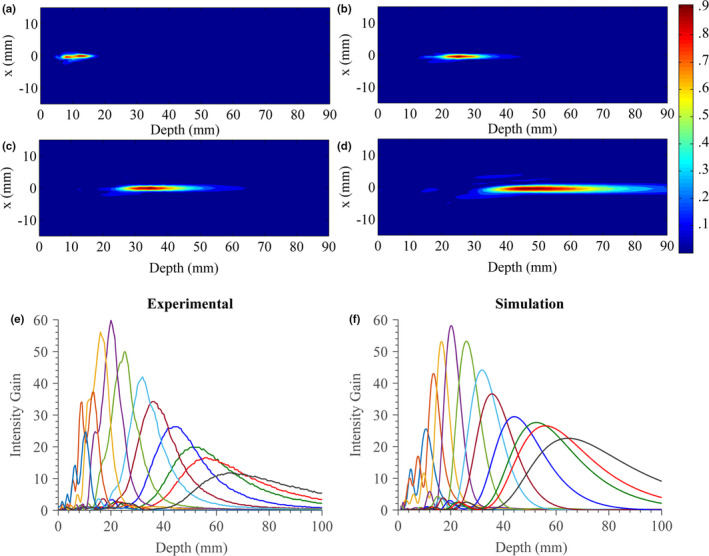
Figure 11.

(a)–(d) Normalized beam plots (pressure‐squared distributions) measured by hydrophone in water for the experimental test applicator assembly at increasing focal lengths or distensions of the fluid lens. (e) Measured and (f) simulated central axial intensity gain profiles at a range of focal lengths. [Color figure can be viewed at wileyonlinelibrary.com]
