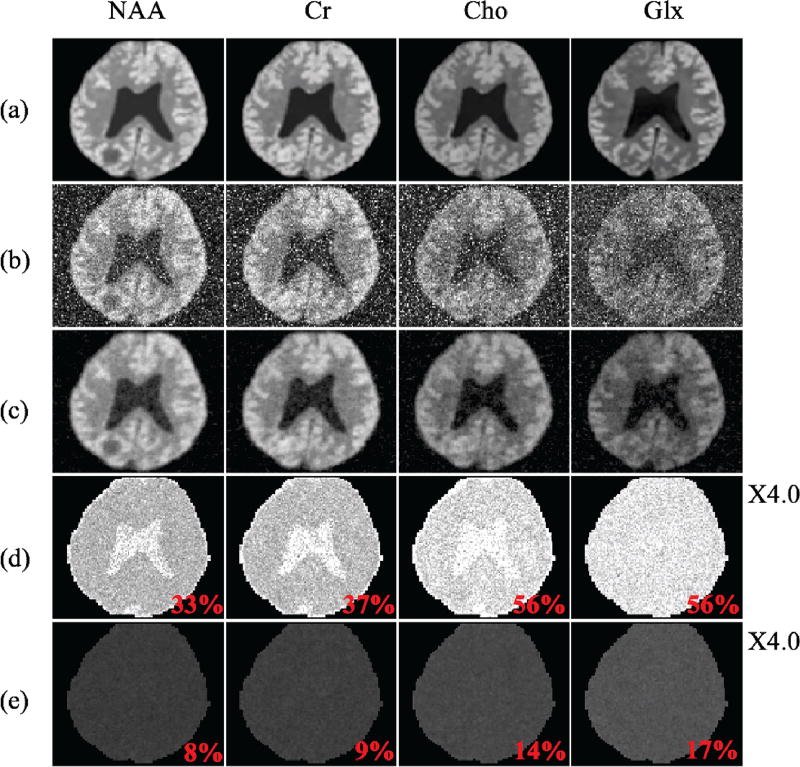
Fig. 2.
Simulation results: (a) true concentration maps for NAA, Cr, Cho and Glx, (b) concentration maps estimated using QUEST, (c) concentration maps estimated using the proposed method, (d) standard deviation (SD) maps (normalized by the true concentrations) for QUEST, and (e) SD maps for the proposed method. The average SDs for each molecule are also shown (in red texts). Note the significant improvement in the estimated concentrations by the proposed method over QUEST.

