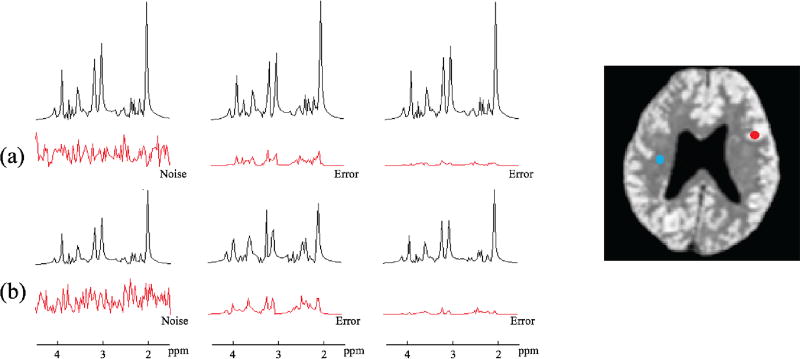
Fig. 3.
Simulation results showing the quality of spectral estimation. Spectra from two representative locations marked by red and blue dots are shown in rows (a) and (b), respectively. The added noise in the original data and the estimation errors are shown in red. As can be seen, the proposed method produced more accurate spectral variations than QUEST.

