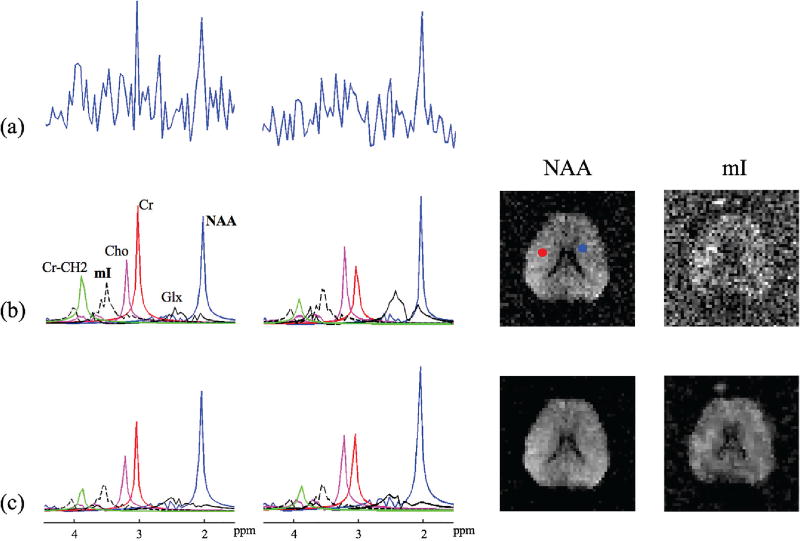
Fig. 4.
Experimental results from an MRSI data set acquired using the conventional EPSI method: (a) noisy spectra from the voxels marked by the color dots, (b) quantification results from QUEST including the estimated individual spectral components and the concentration maps (the mI map is scaled by a factor of 3), and (c) quantification results from the proposed method.

