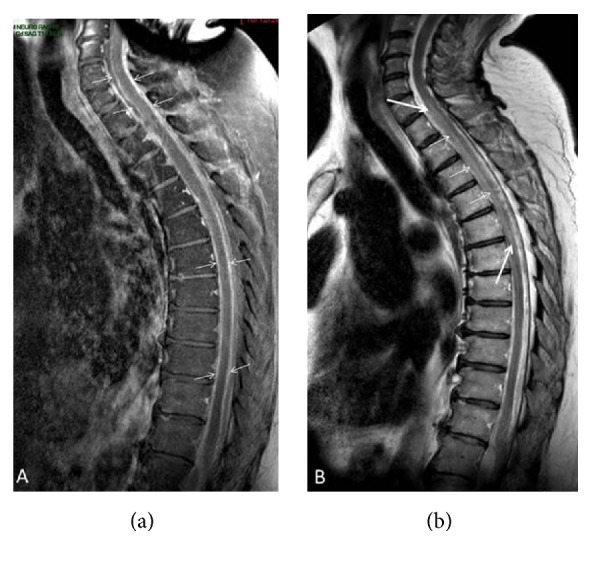
Figure 2.

Follow-up MR examination of the cervicodorsal segments. (a) Midsagittal CE T1-weighted view showing strong enhancement of both dura and pia (between arrows) surrounding spinal cord. (b) Midsagittal T2-weighted view showing relative hypersignal intensity within upper anterior spinal artery territory between T1/T2 and T5/T6 disks (arrows) corresponding to spinal cord infarction.
