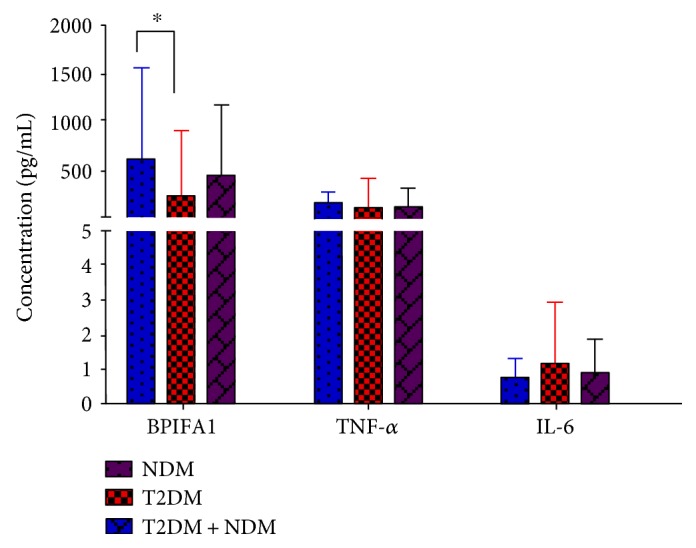
Figure 1.

A histogram showing the concentrations of salivary BPIFA1, TNF-α, and IL-6 (pg/mL, median (IQR)) in NDM and T2DM subjects. The blue stripes represent NDM subjects, the red stripes represent T2DM subjects, and the purple stripes represent all subjects. Each group is presented by median (stripes) and interquartile range (bars). Salivary BPIFA1 concentration was significantly higher in the NDM group than in the T2DM group. The significant differences are indicated by an asterisk (∗P = 0.031). No significant difference in TNF-α or IL-6 concentration was observed between T2DM and NDM groups.
