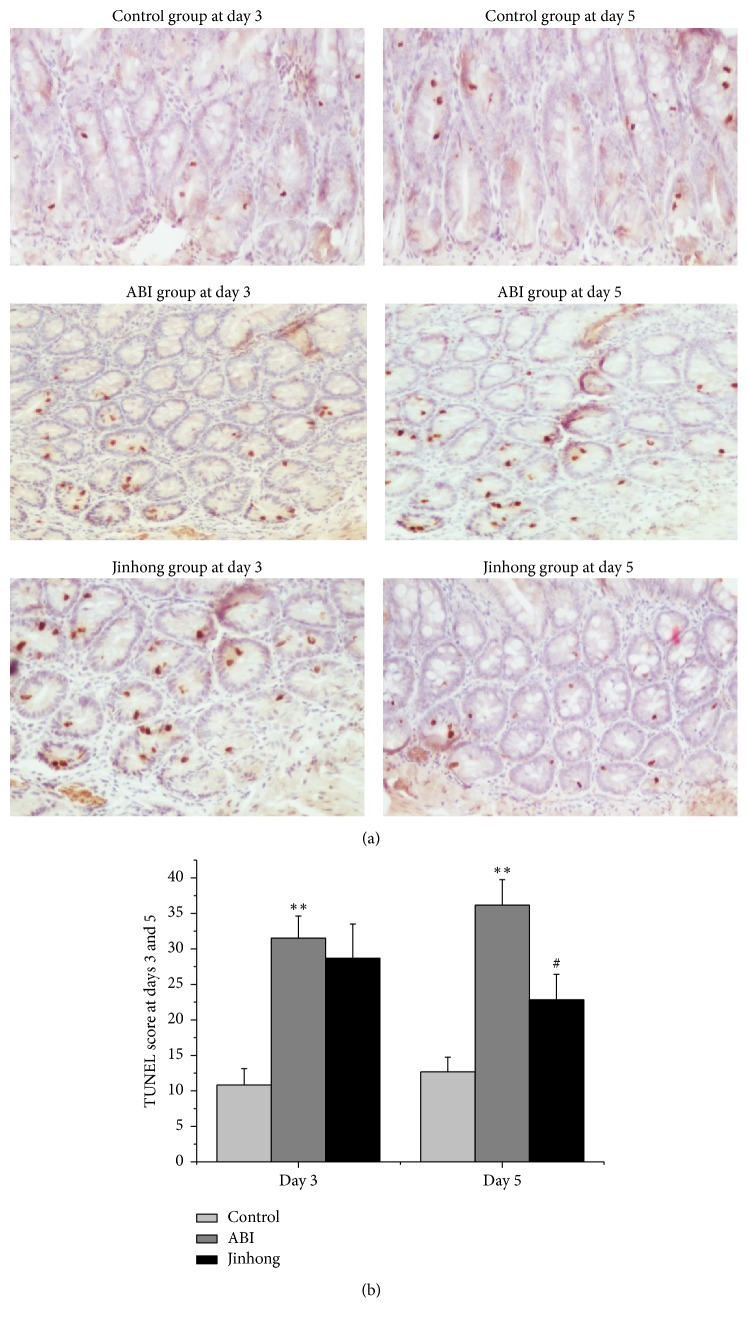
Figure 2.
TUNEL analysis: TUNEL staining for apoptosis on the intestinal tissue at days 3 and 5, respectively ((a), magnification, ×100), and the quantitative data (b) of positive cell numbers. TUNEL-positive cell numbers were significantly increased in ABI group compared with control group at days 3 and 5 (P < 0.01). And the positive cell numbers were significantly reduced in Jinhong group compared with ABI group at day 5 (P < 0.05). Values were expressed as mean ± SD; n = 6 in each group; ∗∗P < 0.01 versus control group; #P < 0.05 versus ABI group.

