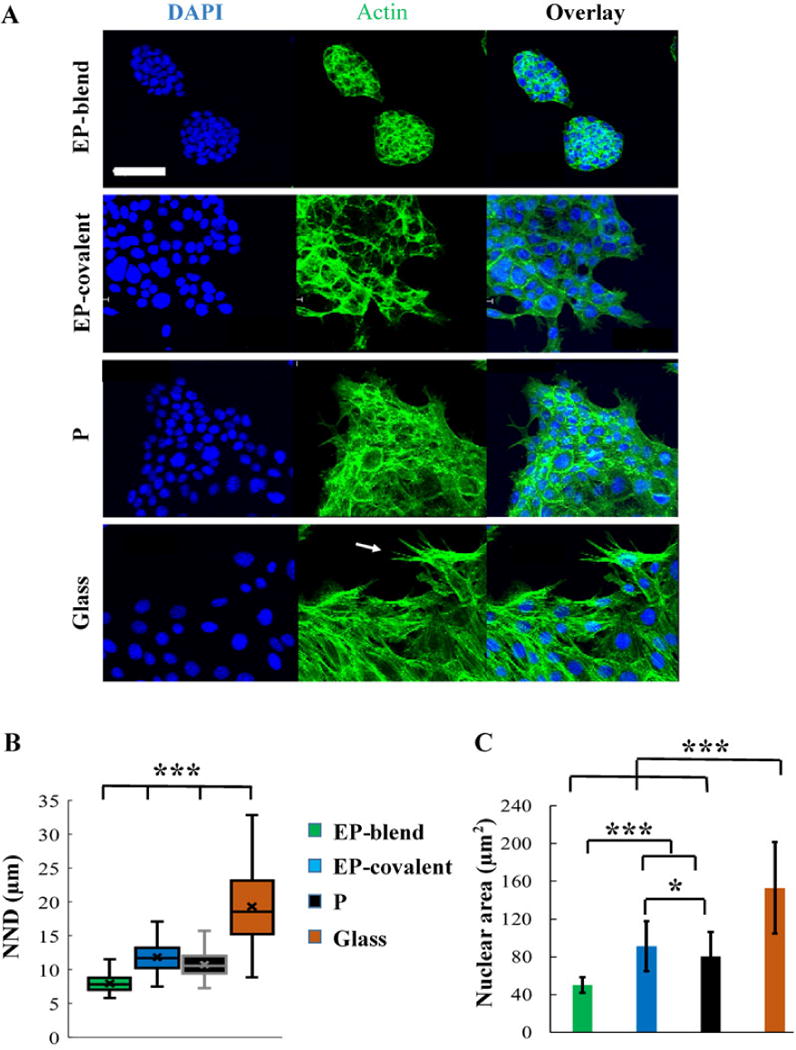
Figure 6.

Elastin as blend electrospinning component supports epithelial cell clustering organization. A- Representative XY confocal images of SIMS cells grown on the different scaffolds for 48 hours showing the clustered cell appearance of SIMS grown on EP-blend as compared to the other scaffolds. Stress fibers are most prominent for SIMS grown on glass (arrow) and least prominent for EP-blend. DAPI (blue), nuclei; F-Actin, green. Scale bar, 50 μm. B- Quantification of cell clustering using nearest neighbor distance (NND) measurements. EP-blend shows the smallest distance, meaning the most clustering. C- Quantification of cell spreading using average nuclear area measurements. EP-blend shows the smallest nuclear area indicating most clustering. Mean ± SD. Single factor ANOVA with Bonferroni’s post-test; *p < 0.05, *** p < 0.001.
