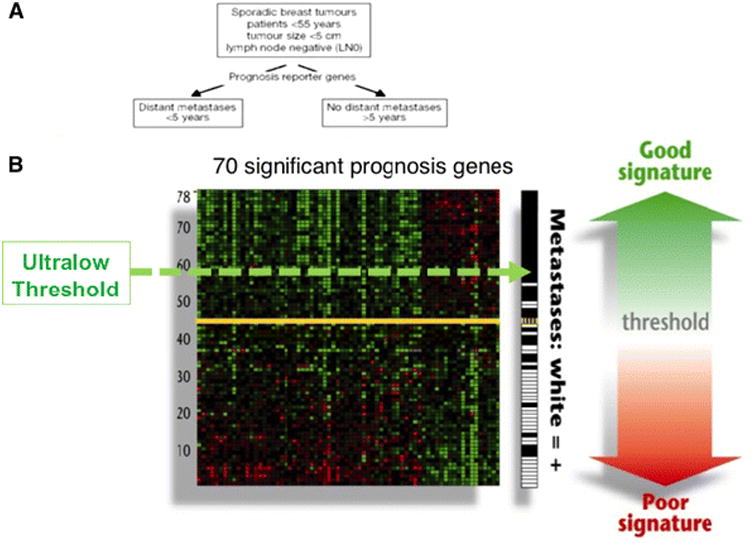
Fig. 1.

Identification of an ultralow risk subset. An additional 70-gene signature index score was designated as ultra-low (threshold at index score = 0.6). Expression array heat map showing the 70-gene profile for the original 78 patients. Every row represents a patient and every column one of the 70 genes. The standard threshold for good prognosis tumors is represented by the thick red dashed line and the threshold for the ultralow risk designation is the thin blue dashed line. Adjacent to the array on the right is the Cosine correlation coefficient to the average good prognosis profile and represents the index score. The column on the far right shows the outcome for each patient either black (absence of distant metastasis) or white (presence of metastasis). Adapted from van't Veer, Nature [7]
