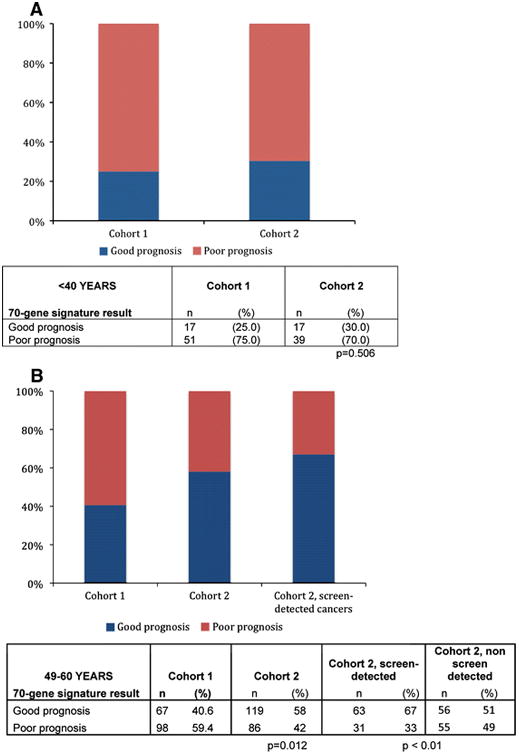
Fig. 2.

Mammographic screening results in an increase in the proportion of good prognosis cancers in Cohort 2, among women invited for population-wide screening. a Percentages of good versus poor prognosis cancers as a fraction of all cancers from Cohorts 1 and 2, respectively, are shown for patients under 40 years. There is no difference in the proportion of good prognosis cancers between Cohorts 1 and 2. Women in this age range did not undergo mammographic screening in either Cohort. b The percentages of good versus poor prognosis cancers as a fraction of all cancers in Cohort 1 and Cohort 2, respectively, are shown for patients aged 49–60 years. This age group was invited to participate in mammographic screening in Cohort 2, but not in Cohort 1. The third column shows the percentages of good versus poor cancers in the subset of Cohort 2 whose cancers were screen-detected. The P value refers the proportion of the low risk cancers as compared with Cohort 1
