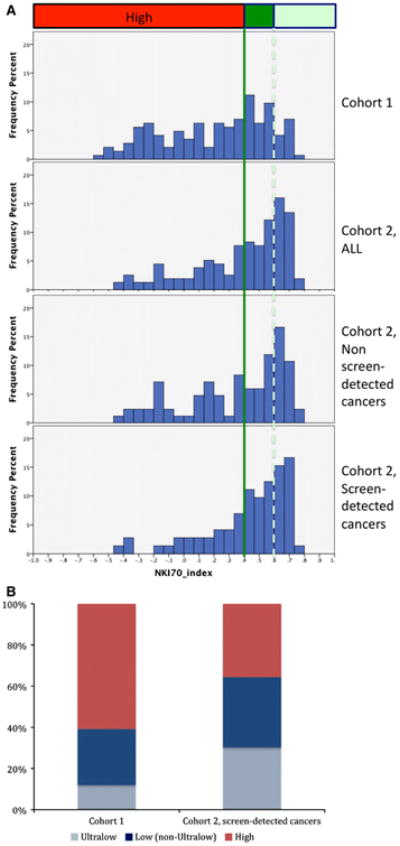
Fig. 3.

Patients from Cohort 2 have tumors with a much higher proportion of low and ultralow risk biology. a Distribution of 70-gene prognosis index scores in women aged 49–60 years in the Cohort 1 (top panel), Cohort 2 (second panel), and the subsets of women from Cohort 2 with non-screen-detected (third panel) and screen-detected (fourth panel) cancers by frequency percent. An index score greater than 0.4 (solid line) corresponds to tumors with a good prognosis (low risk), and an index >0.6 (dashed line) corresponds to ultralow risk. b Distribution of 70-gene signature risk groups as a percentage of total cancers in Cohort 1 versus screen-detected cancers from Cohort 2 in patients aged 49–60 years. The ultralow risk group is defined as index score >0.6, low risk (non-ultralow) is index score between 0.4 and 0.6, and high risk is index score <0.4. In the screen-detected group, 64% are low risk, approximately half of which are ultralow risk
