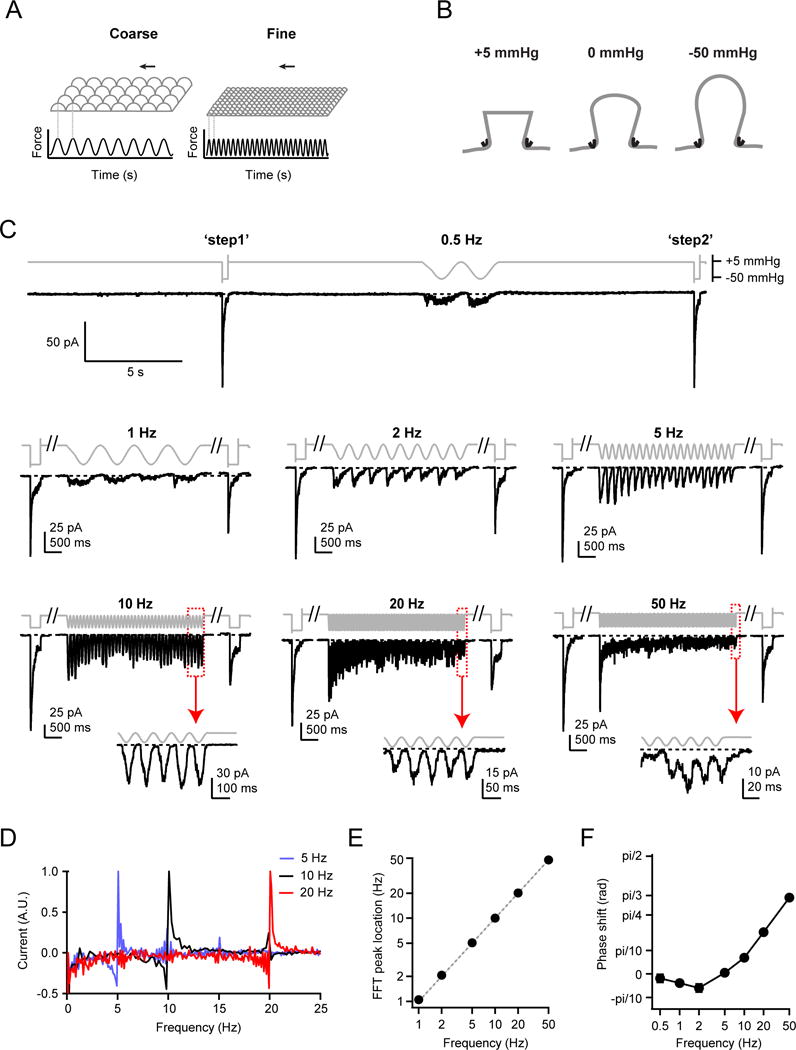
Figure 1. Repetitive sinusoidal pressure stimulation induces phase-locked oscillating inward currents in Piezo1-expressing HEK293t cells.

(A) Schematic depicting two possible stimulus patterns (force over time) sensed by a fingertip brushing over a textured surface. (B) Schematic showing cell-attached high-speed pressure-clamp experiments, in which a small positive pressure (+5 mmHg) minimizes membrane curvature and Piezo1 open probability, while a large negative pressure (−50 mmHg) induces small curvature and high membrane tension and maximal Piezo1 open probability (Lewis and Grandl, 2015). (C) Stimulus protocols and representative raw currents from cell-attached patches from HEK293t cells transiently transfected with Piezo1. 4 s sinusoidal pressure cycles oscillating between +5 and −50 mmHg at frequencies from 0.5 Hz to 50 Hz were applied. Dashed lines are zero current levels. Insets show magnifications of the last five pressure cycles at 10, 20 and 50 Hz. Each current trace is from a separate cell-attached patch. (D) Fast-Fourier transformations (FFT) of the 5 Hz, 10 Hz, and 20 Hz current traces from (C). (E) Average FFT maxima locations as a function of stimulus frequency (N = 68 cells). Error bars are obscured by data points. Dashed grey line represents unity, not a fit to the data. (F) Phase shift of currents relative to pressure stimulus for the last 2 s of stimulation. Error bars are obscured by data points. See also Figures S1, S2, S3.
