
Figure 2. Piezo1 channels function as bandpass filters of sinusoidal pressure stimuli.
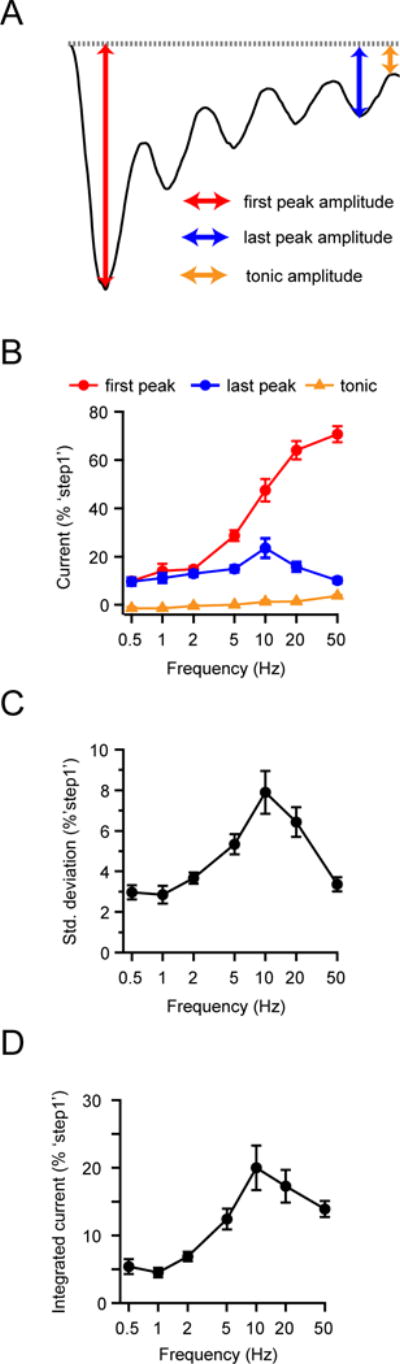
(A) Illustration of current trace with time points for ‘first peak’ (red), ‘last peak’ (blue) and ‘tonic current’ (orange) highlighted. (B) Mean amplitudes of the ‘first peak’, ‘last peak’, and ‘tonic current’ of HEK293t cells transiently transfected with Piezo1 as a function of sinusoidal pressure stimulus frequency. All currents were individually normalized to the peak current of ‘step1’ (see Figure 1C). (C) Standard deviation of current during the last two s as a function of stimulus frequency, normalized to peak amplitude of ‘step1’. All data are mean ± s.e.m.; N = 8–13 cells per frequency. (D) Integrated current during the last two s of a four s sinusoidal pressure stimulus, as a function of frequency, normalized to the peak current of ‘step1’. See also Figure S1.