
Figure 4. A three state gating mechanism describes Piezo1 frequency filtering.
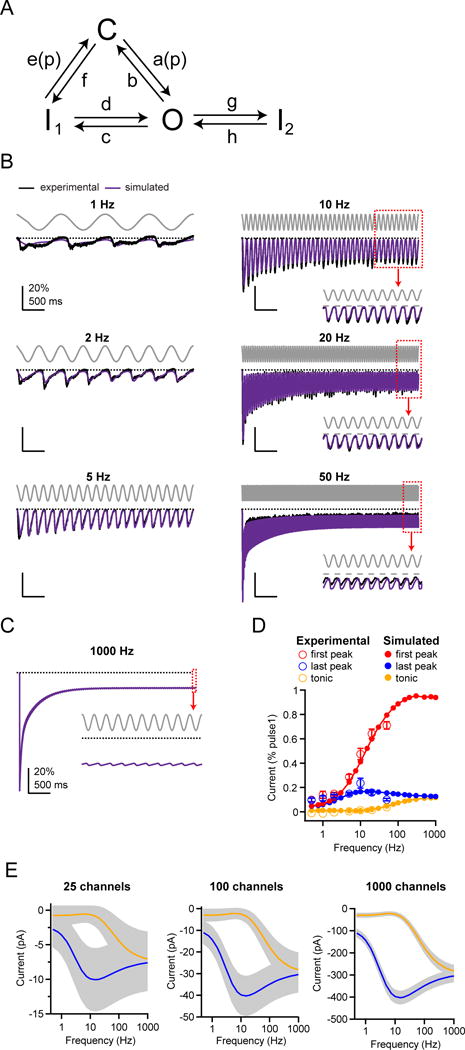
(A) Schematic for a four state gating mechanism for Piezo1, with arrows indicating transitions between open (O), closed (C) and two inactivated states (I1 and I2). Rate constants a(p) = a0·exp(−p/k) (closed to open) and e(p) = e0·exp(p/k) (inactivated to closed) are pressure-dependent. (B) Stimulus protocol (gray), normalized and averaged experimental currents from HEK293t cells transiently transfected with Piezo1 elicited by a sinusoidal pressure stimulus (see Figure 1) (black) and corresponding simulated currents using the best fit to the model in (A) (purple). Dashed line represents zero current. Insets show magnifications of the last pressure cycles. (C) Simulated current response for a 1 kHz sinusoidal pressure stimulus. Inset shows magnifications of the last pressure cycles. (D) Experimental and simulated mean amplitudes of the ‘first peak’ and ‘last peak’ currents and ’tonic‘ current, normalized to ‘step1’, as a function of stimulus frequency. (E) Simulated current amplitudes for mean “last peak” (solid black lines) and “tonic” currents (dashed black lines) and coefficient of variation (gray shading) as a function of stimulus frequency for N = 25, 100, and 1000 channels. Coefficient of variation was calculated as , where q is open probability and I = N*g*V is current. Currents were calculated with a single-channel conductance of 30 pS and a holding potential of −80mV (Coste et al., 2012). See also Figures S4, S5.