
Figure 5. Inactivation is required for Piezo1 frequency filtering.
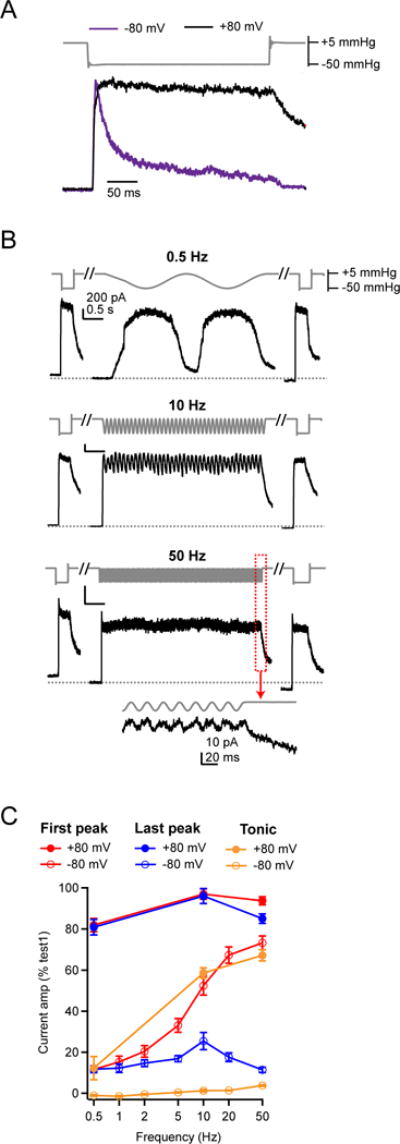
(A) Stimulus protocol (gray) and representative currents in response to a static, 300 ms negative pressure step from two HEK293t cells transiently transfected with Piezo1 in cell-attached patches held at −80 mV (purple, inverted for ease of comparison) and +80 mV (black). Currents are normalized to their peak. (B) Sinusoidal stimulus protocol and representative outward currents from cell-attached patches held at +80 mV. Scale bar (200 pA, 0.5 s) applies to all three traces. (C) Mean amplitudes of the ‘first peak’ and ‘last peak’ current as a function of stimulus frequency. Currents are normalized to the peak amplitude of ‘step1’. All data are mean ± s.e.m.; N = 6–13 cells per stimulus frequency.