Supplemental Digital Content is Available in the Text.
The phonetic parameters of loudness and pitch can separate nociceptive sensations from thermoceptives ones, which might qualify the 2 parameters as nonverbal pain indicators.
Keywords: Vocalization, Nonverbal indicators, Pain, Nociception, Thermoception
Abstract
Introduction and Objectives:
There have, yet, been only few attempts to phonetically characterize the vocalizations of pain, although there is wide agreement that moaning, groaning, or other nonverbal utterance can be indicative of pain. We studied the production of vowels “u,” “a,” “i”, and “schwa” (central vowel, sounding like a darker “e” as in hesitations like “ehm”)—as experimental approximations to natural vocalizations.
Methods:
In 50 students vowel production and self-report ratings were assessed during painful and nonpainful heat stimulation (hot water immersion) as well as during baseline (no-stimulation). The phonetic parameters extracted were pitch (mean F0), phonatory fluctuations (range F0) and loudness (acoustic energy level).
Results:
Only for the vowels “u” and “schwa,” which might be considered best approximations to moaning and groaning, did pitch and loudness increase during pain. Furthermore, changes from nonpainful to painful stimulations in these parameters also significantly predicted concurrent changes in pain ratings.
Conclusion:
Vocalization characteristics of pain seem to be best described by an increase in pitch and in loudness. Future studies using more specific and comprehensive phonetic analyses will surely help to provide an even more precise characterization of vocalizations because of pain.
1. Introduction
Vocalization is a regular accompaniment of pain; with utterances like screaming, mumbling, moaning, groaning, and crying being believed to be pain-indicative. Such nonverbal utterances are in the focus of clinical interest when so-called nonverbal individuals (eg, infants or patients with dementia or delirium)1,3–5,16 are under study. However, these nonverbal utterances are yet merely subjectively rated on observer scales but not phonetically analyzed. Thus, no acoustic-phonetic characteristics like loudness and pitch have been tested whether they qualify for detecting and grading pain in adults. This is surprising, considering the recent interest to find objective “pain signatures” on the basis of physiological parameters obtained by clinically less applicable methods like brain imaging or advanced EEG.2 This neglect of phonetic characterizations of pain vocalizations is even more surprising, given the promising approaches to phonetically characterize utterances of emotions and stress.6,10,11,17,18 Considering mainly loudness and pitch as very basic phonetic parameters, some emotional states and stress have been found to be accompanied by characteristic vocalization patterns. Therefore, one might expect similar state-indicative results for the realm of pain.
The aim of the present study was to investigate the phonetic characteristics of vocalizations during pain in adults. Whereas, previous studies focused on pain vocalizations in newborns eg, Ref. 8, we focused on adult vocalizations because our clinical background was the study of pain in nonverbal seniors (eg, with dementia). The relationship between vocalization, pain sensitivity, and underlying noxious agents because of injury or disease often remains unclear. Such ambiguities can be prevented by experimental methods. However, to reliably trigger spontaneous pain-related vocalizations, very strong pain intensities would be necessary, which are unethical to experimentally apply. Thus, for a first attempt to investigate the phonetic effects of pain, we trained individuals to reliably produce vowels on command, which were thought to be suitable approximations to certain forms of moaning and groaning, and assessed basic phonetic changes (pitch, phonatory fluctuations, and loudness) produced by experimental pain.
2. Methods
2.1. Subjects and design
Vocalizations of 50 students at the University of Bamberg (50% women; mean age: 22.5 years [SD 3.0], all German native speakers), were tested for changes in vowel production (“a,” “u,” “i,” and “schwa” = central vowel [a darker “e” as in hesitations like “er,” and “ehm”], randomized order in experiment) while their hands were immersed in water tanks (20 seconds) with temperatures ranging in 4 ascending steps from 41 to 47°C, thus from nonpainful to painful sensations. Ethical approval was given by the local committee; participants gave written informed consent.
2.2. Phonetic preparation and recording
Participants were trained before testing to evenly produce vowels of 10-second duration by a video-based training designed by the experimenter (M.S.-R.; licensed speech therapist) to reduce intraindividual and interindividual variability and thus, decrease error variance. Vocalization was recorded by a pressure zone microphone (Bayerdynamik, model MPC 50) and transmitted via USB interface to a PC for storage. The signal resolution was (24 bit/48 kHz). The phonetic parametrization was accomplished by the signal-processing software ProsodyPro19 and included loudness (Root Mean Square amplitude, RMS), pitch (mean F0) and phonatory fluctuations (range F0). Within the phonetic community, ProsodyPro is an established and reliable tool that allows for manual outlier checks of F0 measurements. The phonetic parameters obtained during stimulation conditions were baseline corrected (difference scores between stimulation and baseline conditions).
2.3. Thermal stimulation
After a first baseline condition (vowel production without thermal stimulation), 4 stimulation conditions followed (41, 43, 45, and 47°C), where participants had to produce vowels while simultaneously immerging one hand into hot water. At the end, a second baseline condition followed. We used 2 identical tanks with circulating water (Witeg, model wcb-11) for left and right hand. Participants rested the nonstimulated hand on a towel. The body side of first immersion was balanced (50% starting left); thereafter, body sides alternated. After 10 seconds of immersion, participants were asked to produce the vowels for the other 10 seconds of immersion. After each thermal stimulation, subjects had to first rate whether the stimulation was painful or nonpainful and then rated the sensation intensity on Numerical Rating Scales (NRS) for nonpainful (−10no sensation to 0very strong heat) or painful (1mild pain to 10very strong pain) sensations, respectively.
3. Results
3.1. Effects of thermal stimulation and vowels
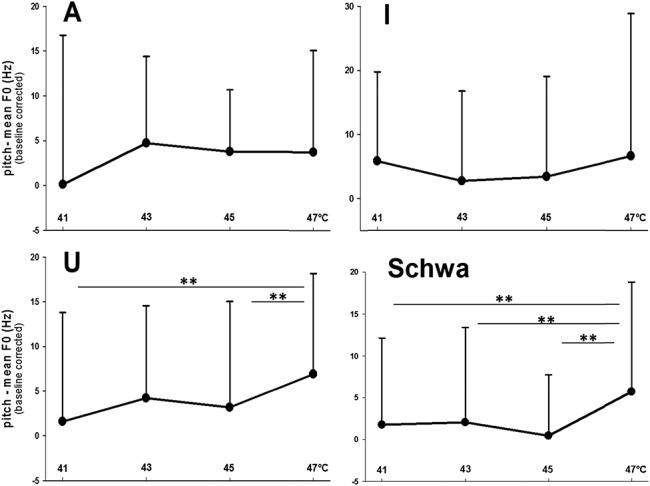
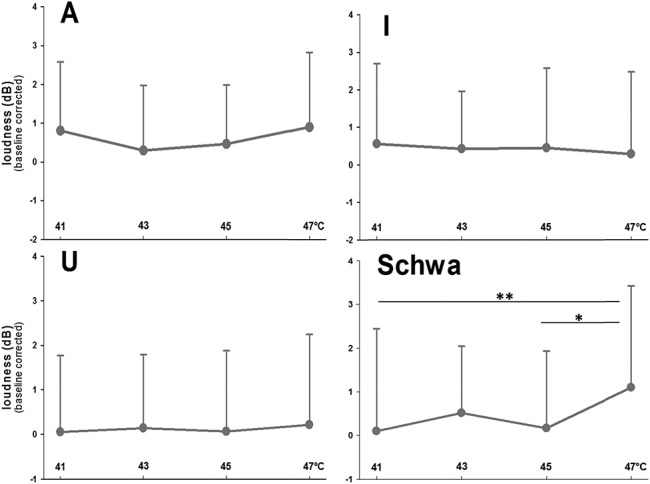
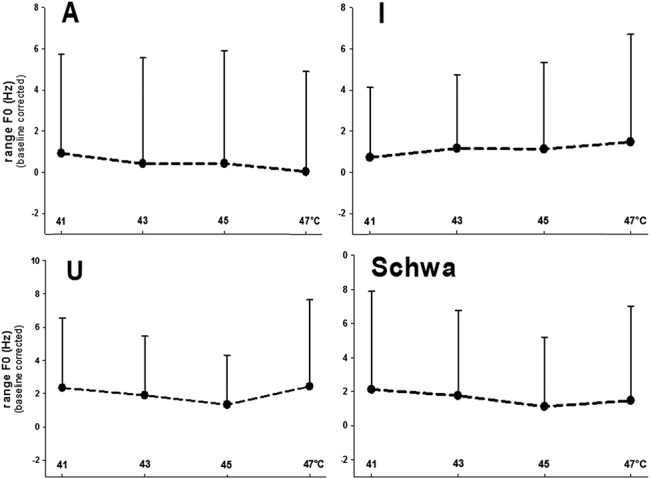
The main analyses were analysis of variances for repeated measurements (2 within-subject factors: “thermal stimulation” and “vowel”). Because the effects of “thermal stimulation” on phonetic characteristics were of interest, only main and interactions effects including the factor “thermal stimulation” were considered. “Thermal stimulation” had a significant effect on pitch (main effect: F(3,147) = 3.53, P = 0.007, η2 = 0.067; Fig. 1) and on loudness (interaction with “vowel”: F(9,441) = 1.93, P = 0.047, η2 = 0.038; Fig. 2). Post hoc analyses for each vowel separately (analysis of variances with only the factor “thermal stimulation”) revealed significant effects of “thermal stimulation” on “u” and “schwa” for pitch (“u”: F = 5.01, P = 0.002, η2 = 0.093; “schwa”: F = 4.35, P = 0.006, η2 = 0.082) and on “schwa” for loudness (F = 4.22, P = 0.008, η2 = 0.079). As an example of the effect of pain on phonetic characteristics, please listen to the audio file of “schwa” recordings during 41°C (no pain) and during 47°C (pain) of a male and a female participant, available at http://links.lww.com/PR9/A6. The effects of “thermal stimulation” were because of significant increases in both phonetic parameters at 47°C (Figs. 1 and 2). According to the NRS ratings, only 47°C was perceived as painful (mean NRS: 2.3 [SD 1.9]), whereas 41°C (mean NRS: −7.2 [SD 4.6]), 43°C (mean NRS: −6.3 [SD 2.1]), and 45°C (mean NRS: −3.4 [SD 3.9]) were rated as nonpainful. Thus, pitch and loudness only increased during painful stimulation and only for “schwa” (central vowel) and “u,” with effect sizes (η2) pointing to moderate effects. The range F0 was not pain-indicative (Fig. 3).
Figure 1.

Mean pitch values (mean F0) across the 4 thermal intensities. Values are given separately for each vowel (“A,” “I,” “U,” and “Schwa”). **Significant post hoc t test results are indicated.
Figure 2.

Mean values of loudness across the 4 thermal intensities. Values are given separately for each vowel (“A,” “I,” “U,” and “Schwa”). **Significant post hoc t test results are indicated.
Figure 3.

Mean values of phonatory fluctuations (range F0) across the 4 thermal intensities. Values are given separately for each vowel (“A,” “I,” “U,” and “Schwa”).
3.2. Correlation between phonetic characteristics and self-report ratings
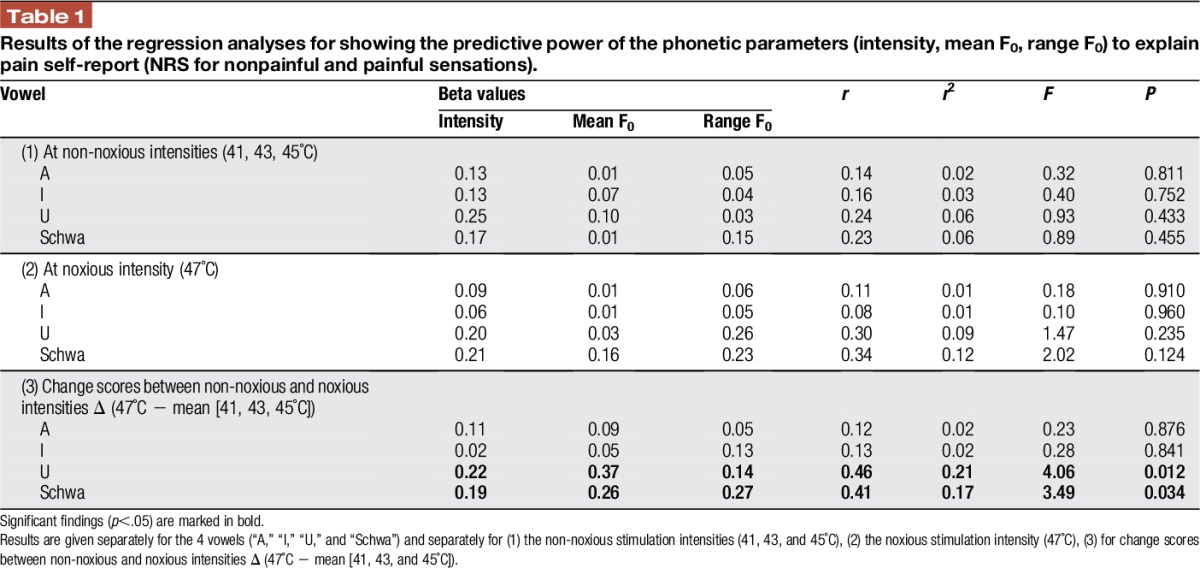
To further investigate which phonetic characteristics are indicative of pain, we conducted regression analyses (Table 1) to investigate which phonetic characteristics could predict the self-report of the participants. Phonetic characteristics could not predict self-report ratings at nonpainful levels (41 to 45°C) or at the painful level (47°C). However, the increases from nonpainful to painful levels in loudness (calculation of change scores), mean F0 and range F0 significantly predicted corresponding changes in NRS ratings. A greater increase in the phonetic parameters of the vowels “u” and “schwa” was associated with a greater increase in NRS ratings.
Table 1.
Results of the regression analyses for showing the predictive power of the phonetic parameters (intensity, mean F0, range F0) to explain pain self-report (NRS for nonpainful and painful sensations).

4. Discussion
Pain-associated increases occurred in loudness and pitch (mean F0) in those vowels (“u” and “schwa”) with most subjective similarity to vocalizations that might be described as groaning or moaning because of pain. The “i,” which was introduced as control vowel being untypical for pain vocalizations, did not show this pattern of results. The range of F0 as parameter of phonatory fluctuations did not present as pain-indicate.
The phonetic parameters of loudness and pitch level clearly separated nociceptive sensations from thermoceptives ones, which might qualify the 2 parameters as nonverbal pain indicators. The 2 parameters have appeared earlier to encode also other forms of distress7,13–15,17 and might therefore not specifically encode pain but negative states in general. Because only the highest temperature (47°C) produced reliably painful sensations, whereas the other temperatures (41 to 45°C) led only to nonpainful thermal sensations, the intensity differences in thermoception are apparently not graded by phonetic changes in pitch and loudness.
Regression analyses reflecting the association between phonetic characteristics and self-report ratings revealed that only the phonetic changes from thermoception to nociception (when considering “u” and “schwa”) could predict changes in the pain experience. Oshrat et al12 also concluded from their phonetic analysis that distinguishing pain from no pain is easier than differentiating pain levels. Such conclusions fit in with previous findings on the facial expression of pain, where facial expressions help to predict self-report ratings when considering changes across different pain intensities.9 This might mean that nonverbal pain indicators such as vocalization and facial expression are better indicators of changes in pain intensity than indicators of absolute intensity. In the future, tonic pain models with dynamic variations in pain intensities should be applied to further test the described association of phonetic and subjective changes. Moreover, further acoustic parameters of source (ie, voice-quality exponents like spectral emphasis or tilt) and filter (ie, formant) characteristics should be included in the set of analyzed parameters and participants with different linguistic backgrounds should be included to test for potential language differences in pain vocalizations.
Finally, the “schwa” proved most pain-indicative because not only did changes in its pitch and loudness occurred while people started to experience pain (for examples please listen to the audio file available at http://links.lww.com/PR9/A6), but these changes also helped to predict corresponding changes in pain ratings.
In summary, the present study showed that phonetic characteristics of vocalization (mainly loudness, pitch) can differentiate pain from nonpainful states and predict changes in pain intensity ratings.
Disclosures
The authors have no conflicts of interest to declare.
Supported by a FNK grant of the University of Bamberg.
Appendix A. Supplemental Digital Content
Supplemental Digital Content associated with this article can be found online at http://links.lww.com/PR9/A6.
Footnotes
Sponsorships or competing interests that may be relevant to content are disclosed at the end of this article.
Supplemental digital content is available for this article. Direct URL citations appear in the printed text and are provided in the HTML and PDF versions of this article on the journal's Web site (www.painjournalonline.com).
References
- [1].Achterberg WP, Pieper MJ, van Dalen-Kok AH, de Waal MW, Husebo BS, Lautenbacher S, Kunz M, Scherder EJ, Corbett A. Pain management in patients with dementia. Clin Interv Aging 2013;8:1471–82. [DOI] [PMC free article] [PubMed] [Google Scholar]
- [2].Apkarian AV. A brain signature for acute pain. Trends Cogn Sci 2013;17:309–10. [DOI] [PMC free article] [PubMed] [Google Scholar]
- [3].Chanques G, Payen JF, Mercier G, de Lattre S, Viel E, Jung B, Cissé M, Lefrant JY, Jaber S. Assessing pain in non-intubated critically ill patients unable to self report: an adaptation of the Behavioral Pain Scale. Intensive Care Med 2009;35:2060–7. [DOI] [PubMed] [Google Scholar]
- [4].Corbett A, Achterberg W, Husebo B, Lobbezoo F, de Vet H, Kunz M, Strand L, Constantinou M, Tudose C, Kappesser J, de Waal M, Lautenbacher S; EU-COST action td 1005 Pain Assessment in Patients with Impaired Cognition, especially Dementia Collaborators: http://www.cost-td1005.net/. An international road map to improve pain assessment in people with impaired cognition: the development of the Pain Assessment in Impaired Cognition (PAIC) meta-tool. BMC Neurol 2014;14:229. [DOI] [PMC free article] [PubMed] [Google Scholar]
- [5].Dubois A, Bringuier S, Capdevilla X, Pry R. Vocal and verbal expression of postoperative pain in preschoolers. Pain Manag Nurs 2008;9:160–5. [DOI] [PubMed] [Google Scholar]
- [6].Guidi A, Schoentgen J, Bertschy G, Gentili C, Landini L, Scilingo EP, Vanello N. Voice quality in patients suffering from bipolar disease. Conf Proc IEEE Eng Med Biol Soc 2015;2015:6106–9. [DOI] [PubMed] [Google Scholar]
- [7].Hammerschmidt K, Jürgens U. Acoustical correlates of affective prosody. J Voice 2007;21:531–40. [DOI] [PubMed] [Google Scholar]
- [8].Johnston CC, Sherrard A, Stevens B, Franck L, Stremler R, Jac A. Do cry features reflect pain intensity in preterm neonates? Neonatology 1999;76:120–4. [DOI] [PubMed] [Google Scholar]
- [9].Kunz M, Mylius V, Schepelmann K, Lautenbacher S. On the relationship between self-report and facial expression of pain. J Pain 2004;5:368–76. [DOI] [PubMed] [Google Scholar]
- [10].Marquard C, Brodersen M, Baasch C, Niebuhr O, Schmidt G. Speech under stress. Conf Proc 43th Annual Meeting of German Acoustical Society; September 26–28, 2017; Kiel, Germany.
- [11].Niebuhr O. Who wants to be a blabbermouth? - Prosodic cues to correct answers in the WWTBAM quiz show scenario. Conf Proc 8th Speech Prosody; May 31–June 3, 2016; Boston, MA: 994–98.
- [12].Oshrat Y, Bloch A, Lerner A, Cohen A, Avigal M, Zeilig G. Speech prosody as a biosignal for physical pain detection. Conf Proc 8th Speech Prosody; May 31–June 3, 2016; Boston, MA: 420–24.
- [13].Pisanski K, Nowak J, Sorokowski P. Individual differences in cortisol stress response predict increases in voice pitch during exam stress. Physiol Behav 2016;163:234–8. [DOI] [PubMed] [Google Scholar]
- [14].Scherer KR. Expression of emotion in voice and music. J Voice 1995;9:235–48. [DOI] [PubMed] [Google Scholar]
- [15].Scherer KR. Vocal communication of emotion: a review of research paradigms. Speech Commun 2003;40:227–56. [Google Scholar]
- [16].Solodiuk JC. Parent described pain responses in nonverbal children with intellectual disability. Int J Nurs Stud 2013;50:1033–44. [DOI] [PubMed] [Google Scholar]
- [17].Sondhi S, Khan M, Vijay R, Salhan AK, Chouhan S. Acoustic analysis of speech under stress. Int J Bioinform Res Appl 2015;11:417–32. [DOI] [PubMed] [Google Scholar]
- [18].Tolkmitt F, Helfrich H, Standke R, Scherer KR. Vocal indicators of psychiatric treatment effects in depressives and schizophrenics. J Commun Disord 1982;15:209–22. [DOI] [PubMed] [Google Scholar]
- [19].Xu Y. ProsodyPro—a tool for large-scale systematic prosody analysis. 2013. In Proceedings of Tools and Resources for the Analysis of Speech Prosody (TRASP 2013), Aix-en-Provence, France. 30 August, 2013: 7–10. [Google Scholar]


