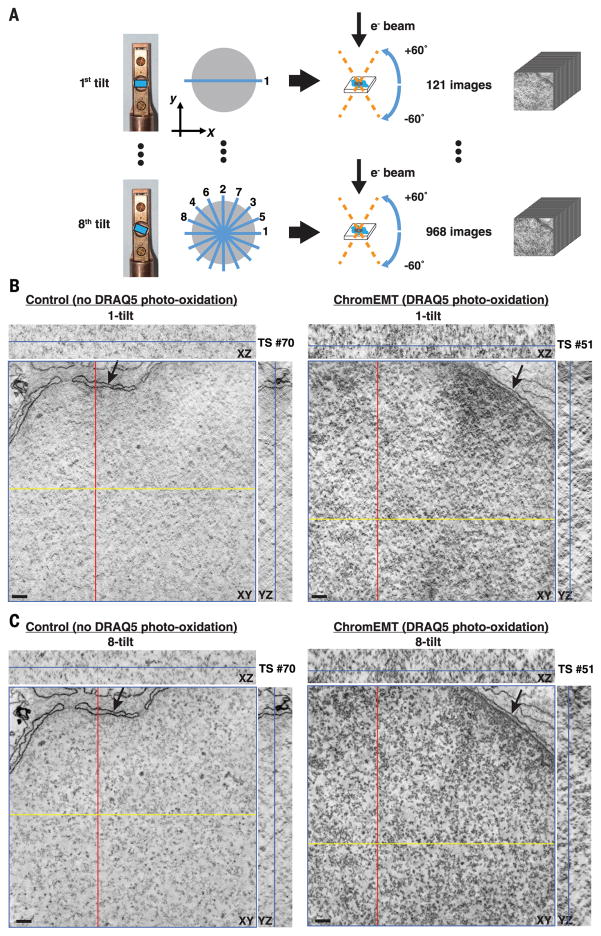
Fig. 3. ChromEMT and eight-tilt EMT enable chromatin to be visualized with high-contrast and spatial resolutions through large 3D volumes.
SAECs were fixed with glutaraldehyde and stained with DRAQ5. Cells were either left untreated (control) or excited for 6 min to photo-oxidize DAB. Samples were stained with OsO4, cut into 250-nm sections, and imaged by EMT. (A) Single-(121 images) and eight-tilt EMT data sets (968 images) were collected by rotating the sample block from –60° to +60° at the depicted orientations (blue lines). (B) Collected data set was reconstructed into an EM tomogram of 1666 nm (x) by 1619 nm (y) by 231 nm (z). Tomographic slices (TSs) from single-tilt data sets of control (left) and photo-oxidized nuclei (right). The xy image and the respective xz and yz cross-sectional views are shown.The blue line in the xz and yz cross sections shows the z position of the xy image. Scale bar, 100 nm. (C) Same as (B) for an eight-tilt data set.

