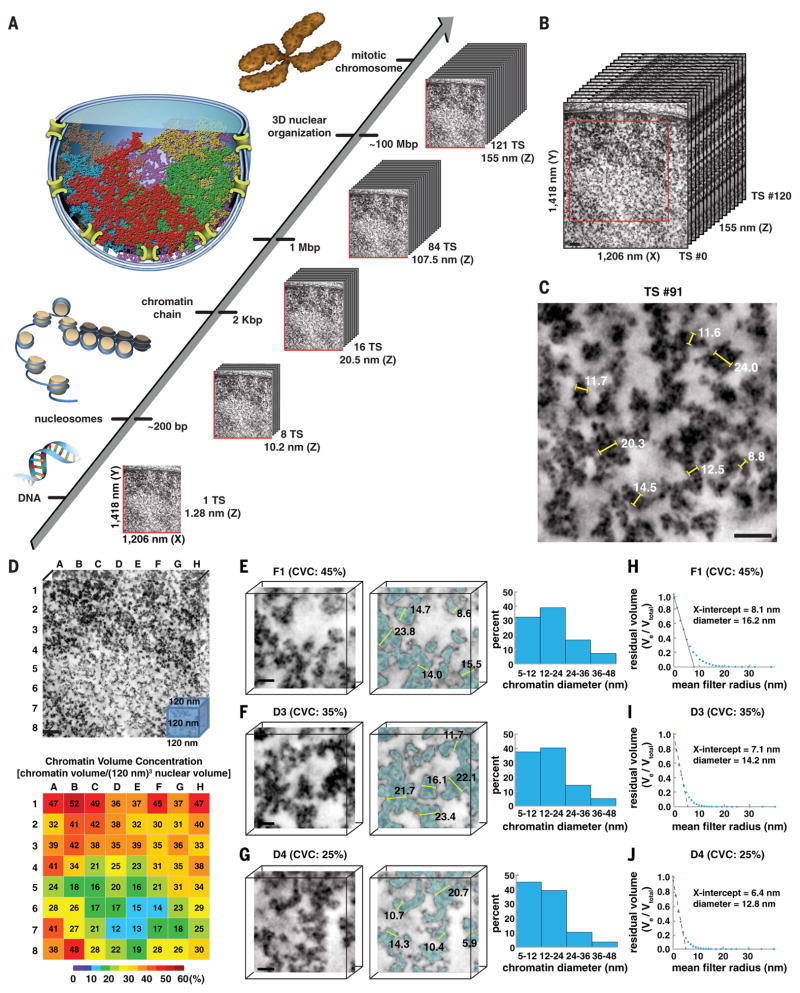
Fig. 4. Chromatin is a disordered chain that has diameters between 5 and 24 nm and is packed together at different concentration densities in interphase nuclei.
(A) ChromEMT enables the ultrastructure of individual chromatin chains, megabase domains, and mitotic chromosomes to be resolved and visualized as a continuum in serial slices through large 3D volumes. (B) Reconstructed eight-tilt EMT data set (SAEC #1) of ChromEM-stained SAECs comprising 121 TSs (each 1.28 nm thick). Scale bar, 100 nm. To visualize chromatin and 3D organization as a continuum through the entire EMT data set, we compiled serial slices into a movie (Movie 2). (C) Manual measurements of chromatin diameters in a single TS. Scale bar, 50 nm. (D) The central EMT volume [red box in (B), 963 nm by 963 nm by 120 nm] was divided into an 8-by-8 grid comprising 64 subvolumes of 120-nm cubes. Chromatin volume concentrations (CVCs) are shown in the heat map. Scale bar, 100 nm. (E to G) The surface-thickness function was used to determine chromatin diameters in subvolumes with high (45%), medium (35%), and low (25%) CVCs. Irrespective of CVC, there are two major bin peak distributions for chromatin diameter: 5 to 12 nm and 12 to 24 nm. Scale bar, 20 nm. (H to J) Continuous erosion analysis to determine average chromatin diameter. The residual chromatin volume (Ve/Vtotal) is plotted against the spherical mean filter radius. The average radius of chromatin in each subvolume is the x-axis intercept of a linear fit of the first five erosion factor sizes.

