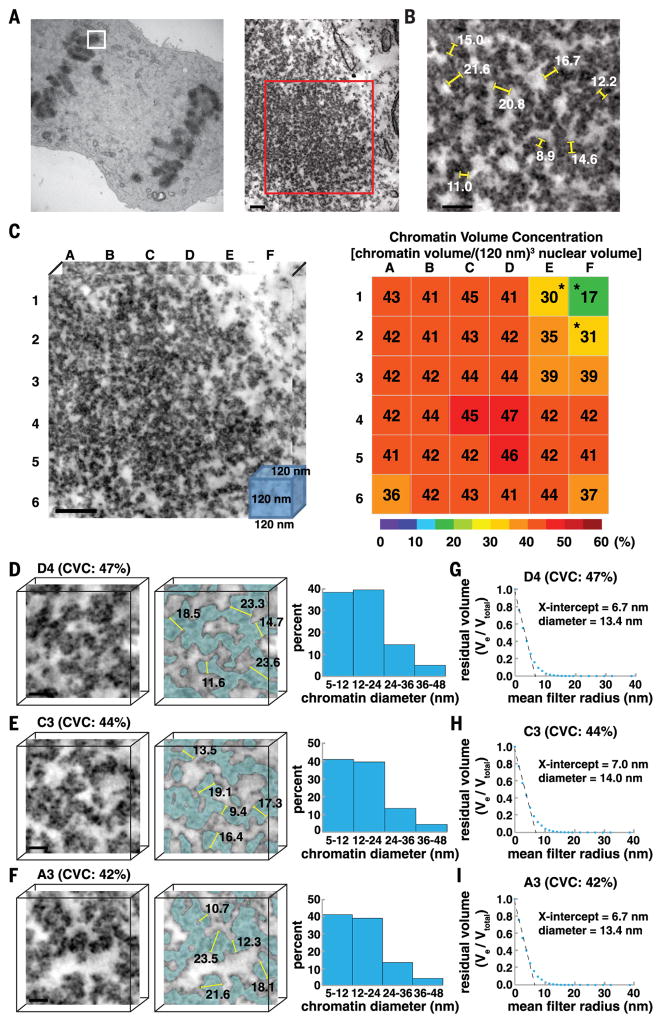
Fig. 7. In mitotic chromosomes, disordered 5- to 24-nm diameter chromatin chains are packed together at high 3D concentration densities.
(A) An eight-tilt EMTdata set (1024 nm by 1280 nm by 180 nm; 141 total TSs, each 1.28 nm thick) of a mitotic chromosome (white box, left panel) at 29,000× (red box, right panel). Scale bar, 100 nm.To visualize chromatin ultrastructure and 3D organization as a continuum, see Movie 4. (B) Manual measurements of chromatin diameter in a single TS. Scale bar, 50 nm. (C) The mitotic chromosome [red box in (A), 722 nm by 722 nm by 120 nm] was divided into 36 subvolumes of 120-nm cubes. CVCs are shown in a heat map. Asterisks indicate cytoplasmic fractions. Scale bar, 100 nm. (D to F) Surface-thickness estimates of chromatin diameters.There are two major bin distributions: 5 to 12 nm and 12 to 24 nm (right panel). Scale bar, 20 nm. (G to I) Continuous erosion analysis to estimate average chromatin diameter (x-axis intercept).

