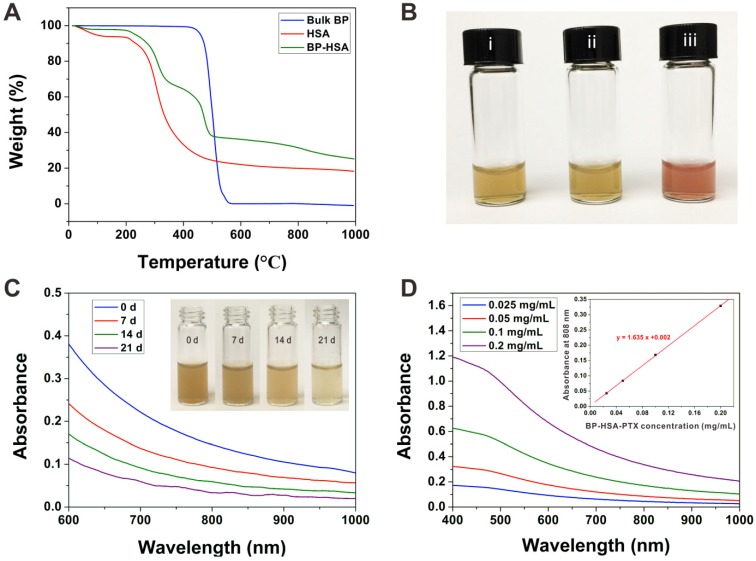
Figure 2.
(A) TGA of BP, HSA and BP-HSA. (B) Photographs of BP-HSA-PTX dispersed in water (i), PBS (ii) and DMEM + 10% FBS (iii). (C) Time-dependent changes in absorption spectra of BP-HSA-PTX solution. Inset: photographs of BP-HSA-PTX dispersed in water for different times. (D) Absorbance spectra of BP-HSA-PTX supernatant. Inset: The absorbance of BP-HSA-PTX at a wavelength of 808 nm as a function of the concentration.

